a PyPI package for analyzing customer reviews using aspect-based opinions mining and sentiment analysis
![]()

![]()
reviewminer is built for analyzing customer reviews, or any text datasets that are similar to review data (short opinions
collected from multiple individuals). It is built on top of nltk and TextBlob.reviewminer takes the pain out of building NLP pipelines (for analyzing customer reviews) and provides handy tools
for quickly organizing review data into digestible insights.
Features:
$ pip install reviewminer
We use the Women’s Clothing E-Commerce dataset on Kaggle to run the examples.
import reviewminer as rmimport pandas as pd# read our sample datareviews_df = pd.read_csv("https://raw.githubusercontent.com/tianyiwangnova/2021_project__ReviewMiner/main/sample_data/Womens%20Clothing%20E-Commerce%20Reviews.csv")# create a reviewminer objectsample_rm = rm.ReviewMiner(reviews_df, id_column="Id", review_column='Text')# run the one time analysis and you will seesample_rm.one_time_analysis()
The function will print out 4 visualizations:
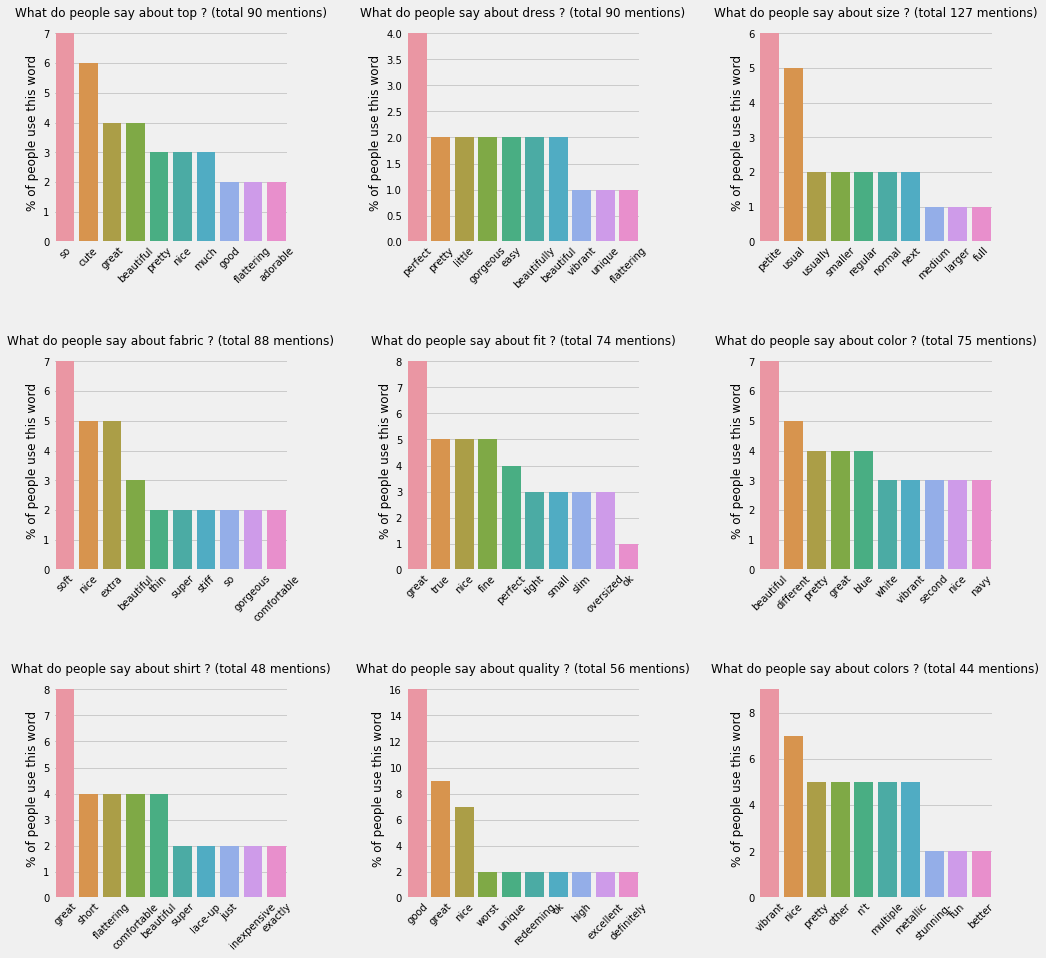
This chart displays 9 most common aspects found in the reviews and the most popular opinions words people used to
describe them. In each bar chart, the heights represent the percentages of the people using the opinion words.
Distribution of sentiment scores of all comments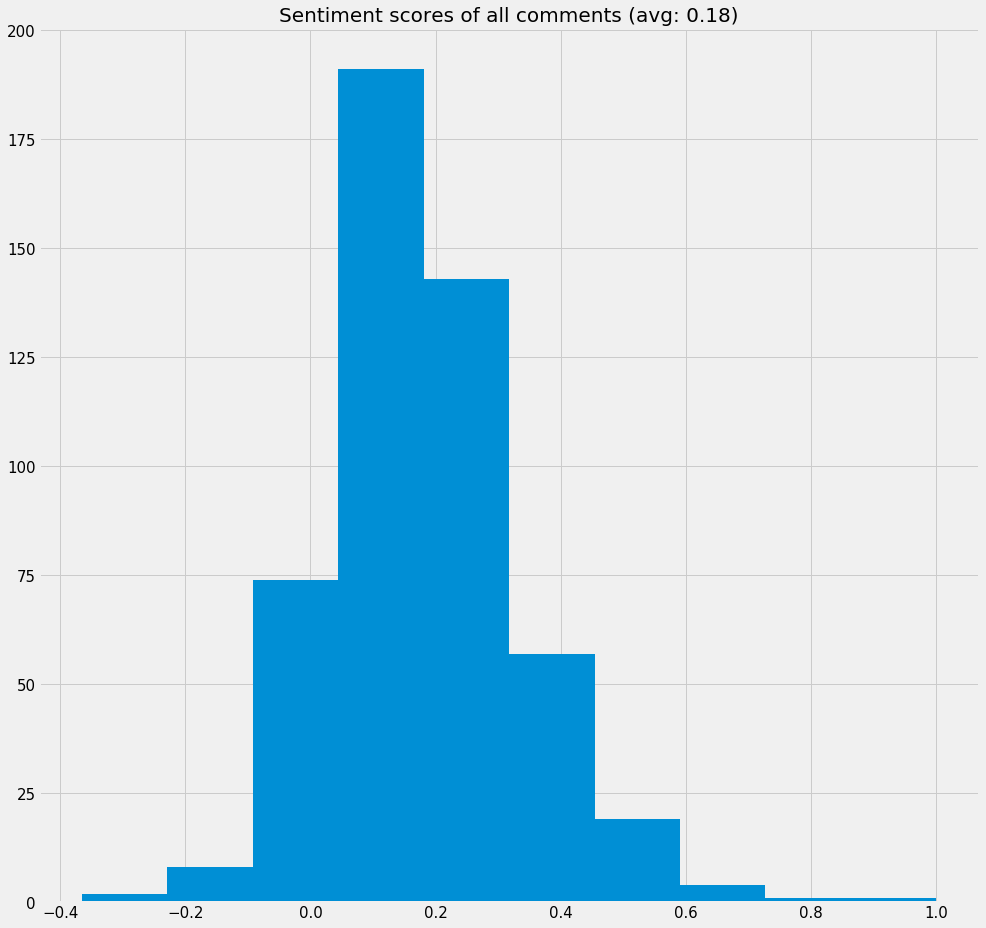
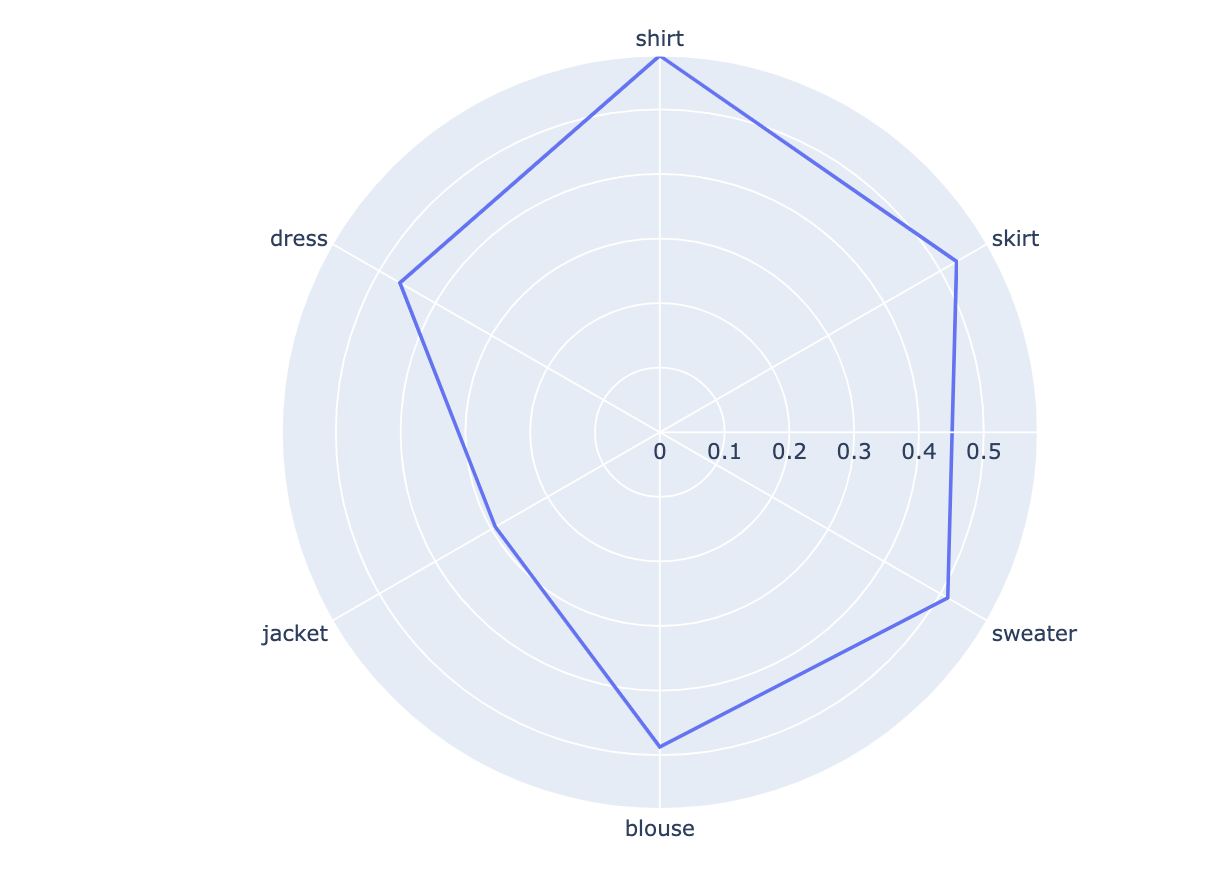
Radar chart of the most common aspects and their average sentiment scores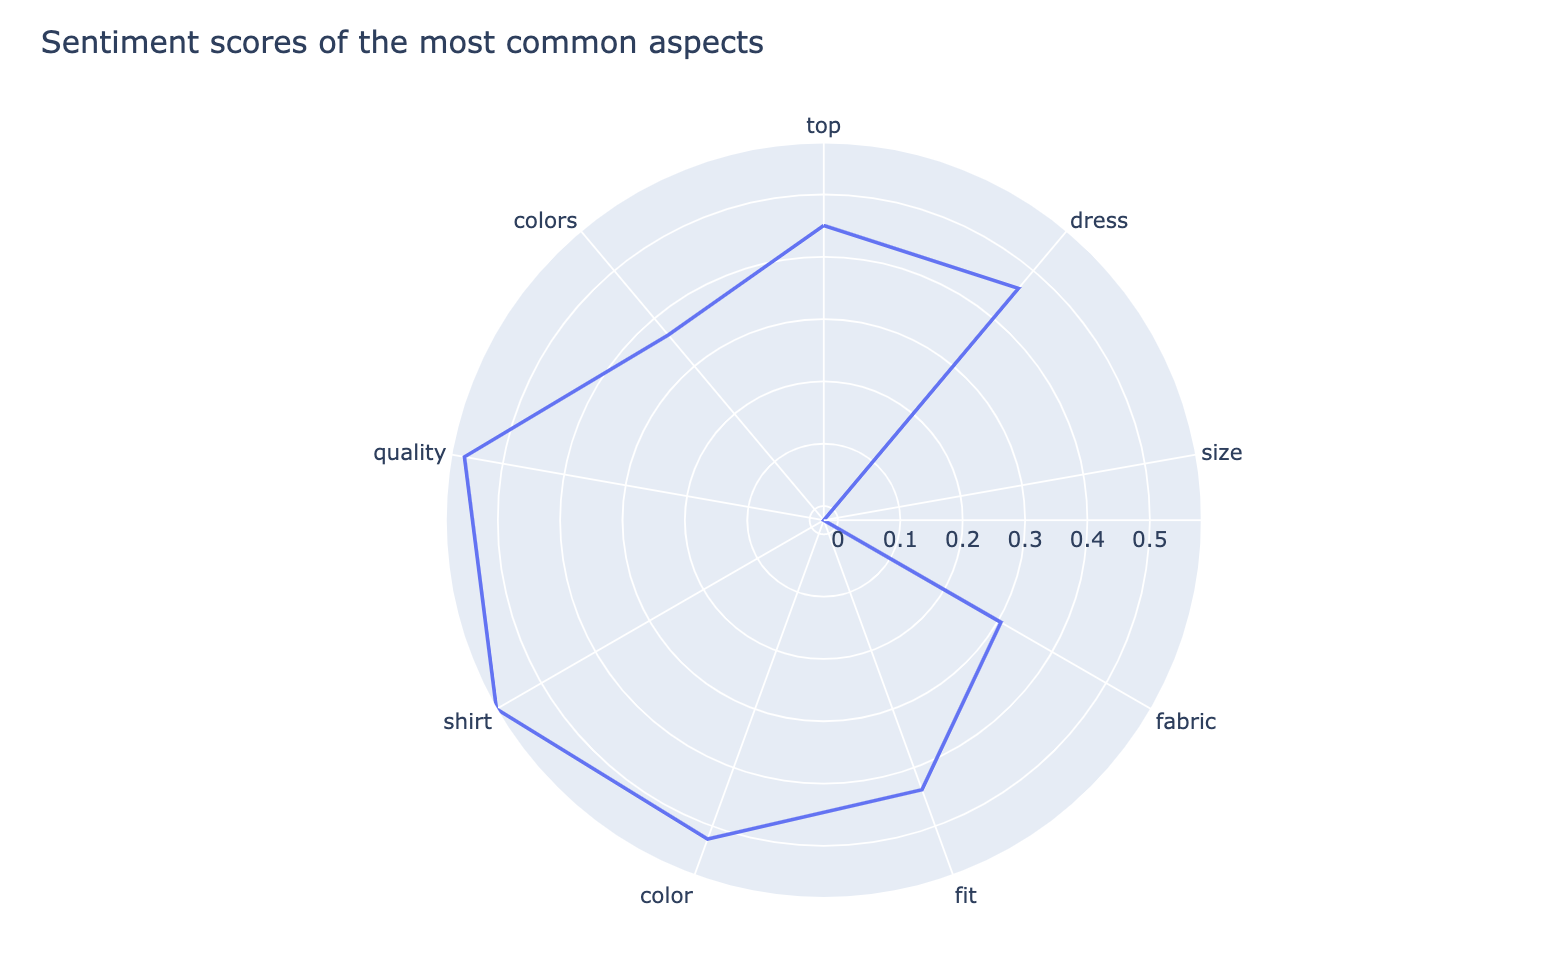
From this chart you can quickly compare customers’ average sentiment on each of the common aspects. Here “size” seems to be an aspect that customers are not quite satisfied with.
You might want to exclude some aspects. For example, if you don’t want the aspect “colors”, you can do the following:
print("Before:", sample_rm.top_aspects)sample_rm.aspect_mute_list = ['colors']print("After:", sample_rm.top_aspects)

When aspect_mute_list has changed, the visualizations will change as well when the related methods are calling, but the
base intermediate output tables (e.g. aspect_opinion_df) won’t change.
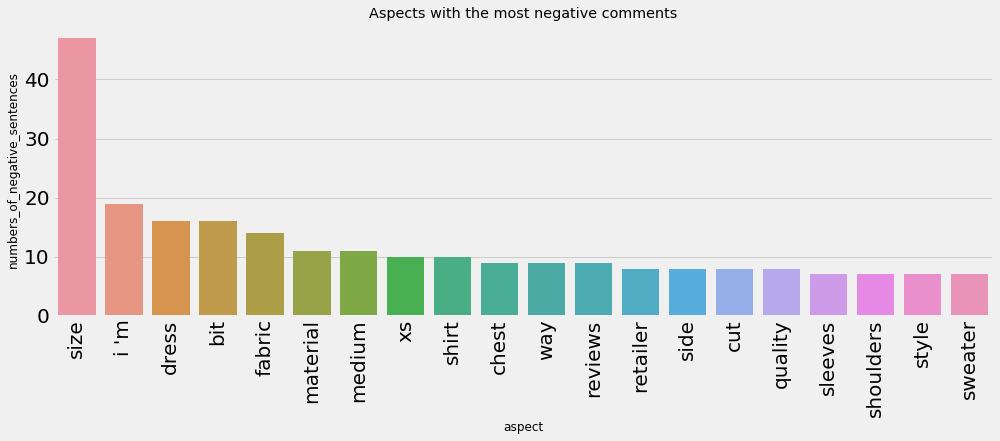
From the radar chart above we saw that customers might not be very satisfied with “sizes” of the clothes. Let’s check out the negative comments around “size”
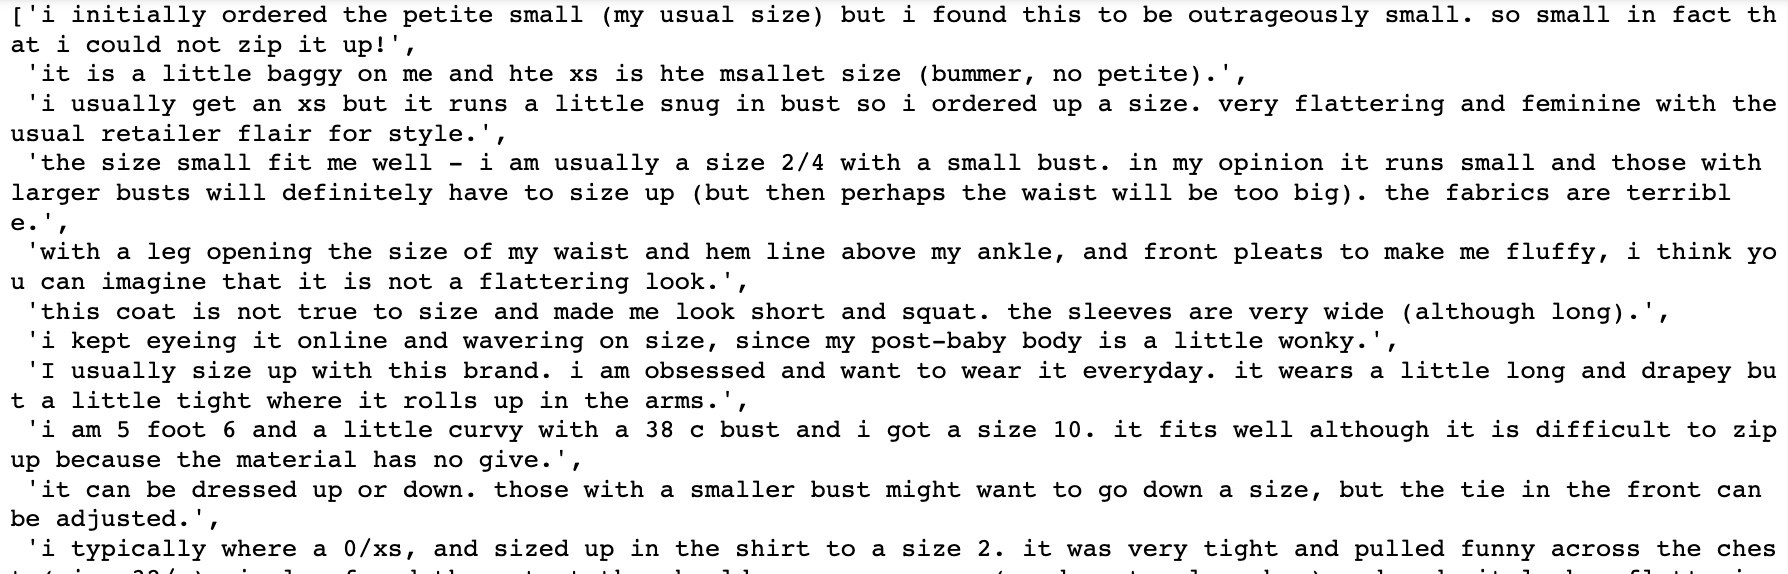
sample_rm.negative_comments_by_aspects_dict['size']
sample_rm.single_aspect_view("material")
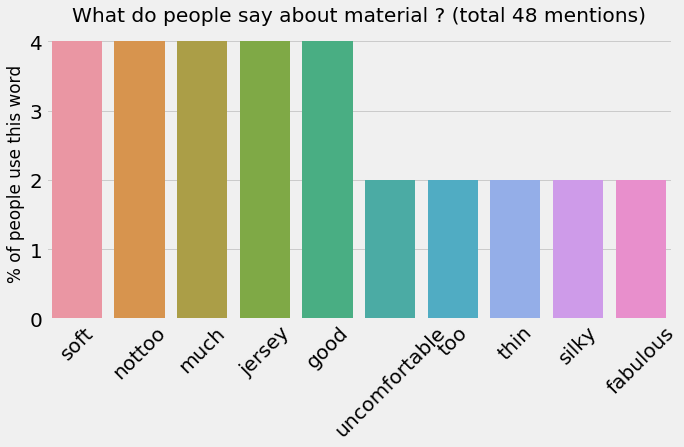
This dataset is not very large so the numbers are not quite prominent.
sample_rm.aspects_radar_plot(['shirt','skirt','sweater','blouse','jacket','dress'])
It’s better to feed in review data on a specific product or service. If you run it on the review data for a specific
ramen restaurant, it’s easier to find meaningful aspects. If you feed in Amazon reviews for 5 totally different
products, the insights might not be very clear.
Sometimes a sample of the data can tell the whole story. If you have a million reviews, the result will be very similar
to the result you get from a random sample of 10k reviews. Don’t rush to feed all your data in, try with a sample first ;)