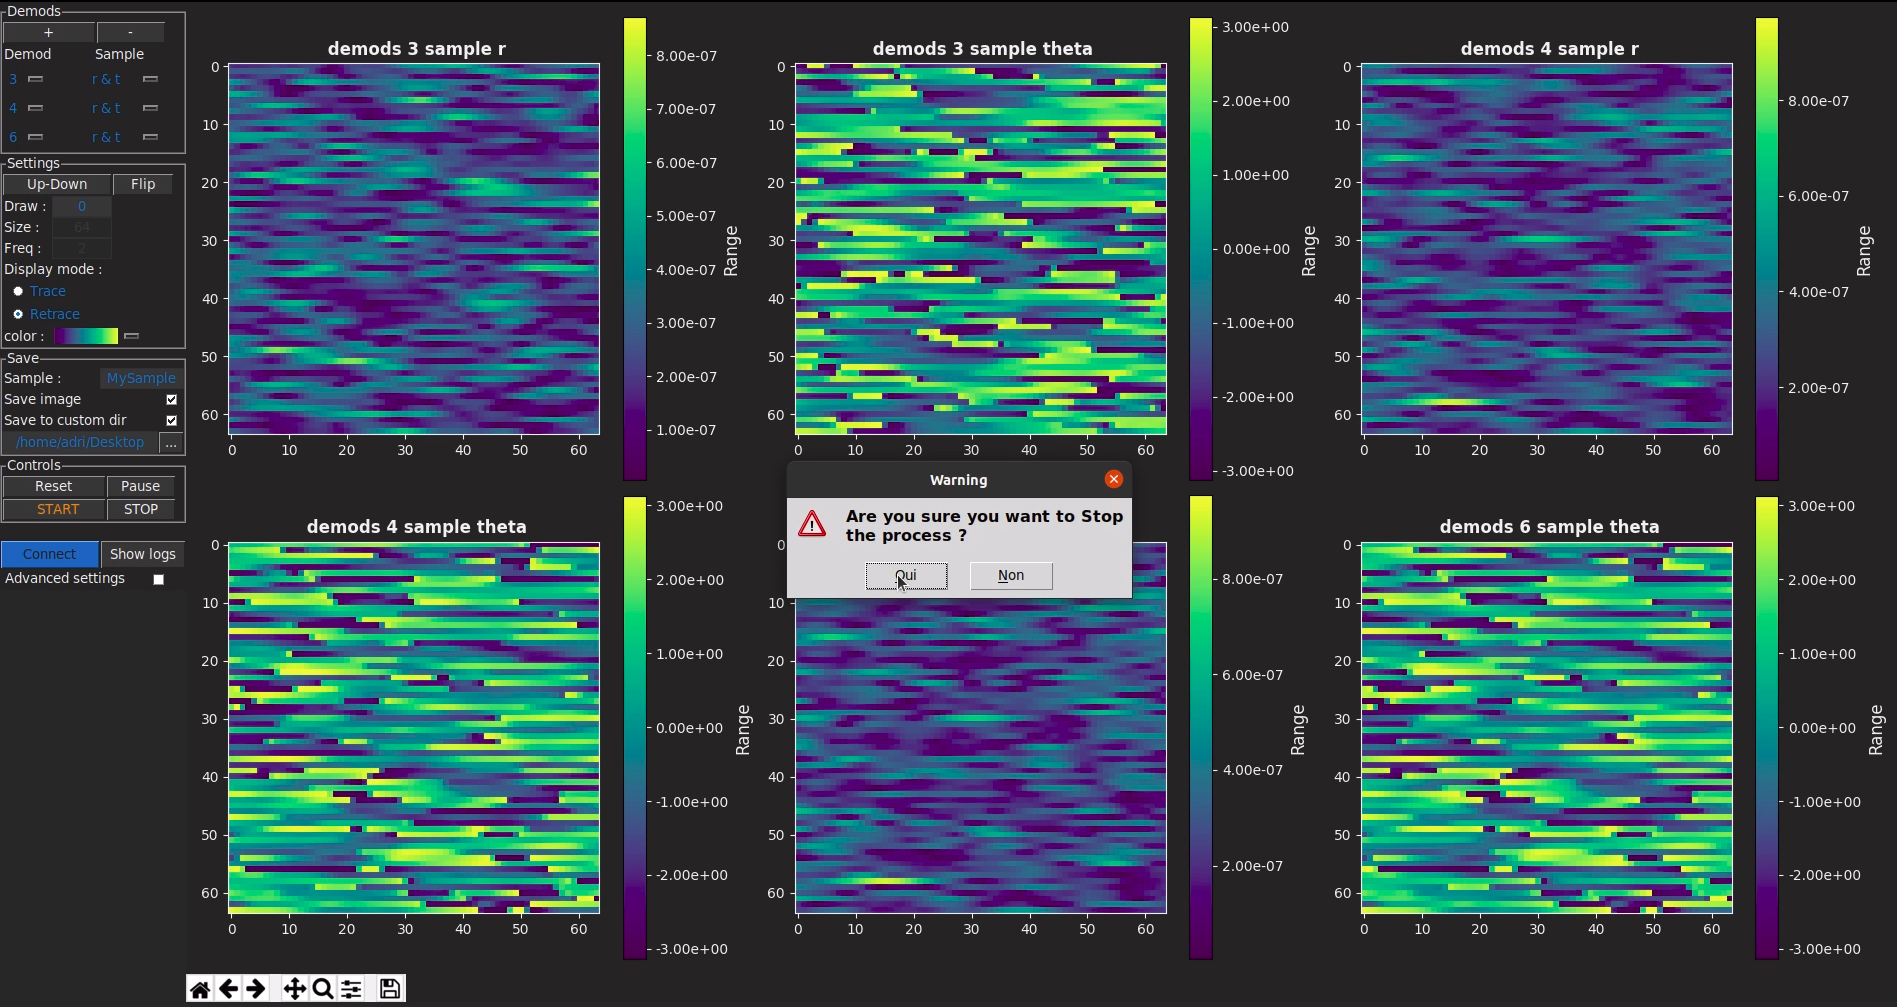
Plot of internal demod data streams of HF2LI during AFM scan (Synchronized with Nanoscope V)
![]()
![]()

This application is not a replacement for the Zurich instruments Labone software, it is meant to be used along side it. You still have to use Labone and connect your instrument to it.
The goal of this application is to be able to bypass the limitation of using the 4 auxiliary signals of the HF2LI by taking the signals data directly from the HF2LI through the USB port instead of coaxial cables. The application will communicate with the HF2LI API using Python to obtain all the demodulators data streams (R, Theta, X, Y, Frequency) we need and plot as many graphs as we want. It has more specifically been built for DFRT PFM, you can also see Guide of David ALBERTINI
update : Zi² and its creator have been cited in the Zurich Instruments Q4/2020 News Letter in the User Story section, there is also an interview of David ALBERTINI !
There are two ways of running this application, either using an simple EXE for Windows that has to be launched within its folder (because they contain all the python modules, application data etc…) and that requires no installer.
Or by running the Source code of the application with Python and all the modules. In which case you’ll need :
Numpy module version 1.19.0, to deal with matrixes and data
pip install numpy
pip install zhinst
pip install matplotlib==3.2.2
pip install DateTime
pip install pillow
The versions of the modules shouldn’t cause any problems except for matplolib which for some reason won’t run in an EXE in versions upper than 3.2.2, I just included my versions in case you have problems and want to replicate my setup to avoid any conflict.
pip install gwyfile
Like i said there no installer, just a folder wich contains all the necessary files.
If you want the Windows EXE version than :
If you want to run the source code than :
Here you can see the “Command” part of the GUI which is divided in Tabs
Demods
In which you can select the demod you want and the data you want to plot from it
Settings (line by line)
Save
Connexion & more (appears if you check advanced settings)
Controls
The application is protected by the CeCILL-C FREE SOFTWARE LICENSE AGREEMENT
“The purpose of this Free Software license agreement is to grant users the right to modify and re-use the software governed by this license. The exercising of this right is conditional upon the obligation to make available to the community the modifications made to the source code of the software so as to contribute to its evolution.”
You can also read the full LICENSE
You can contact me at adrianos.sidiras@gmail.com, however I no longer work on this project since it was for a 2 months internship
I’d like to thank the INL and both of my internship tutors, David ALBERTINI david.albertini@insa-lyon.fr and Nicolas BABOUX and for the guidance they provided in this project, as well as Mehdi ALEM mehdi.alem@zhinst.com from the Zurich instruments support team which did an amazing job of explaining how to properly use of the HF2LI programming features.
Please consider reading the manual to see common errors if something goes wrong, and if the problem can’t be solved i re-command you read Zurich instrument’s manual
if you have the necessary knowledge i also encourage you to modify the source code so as to solve the problem and share your results with the community.
version 1.1 as launched with some minor tweaks to the GUI, and and the plotting of the data, see release notes for more information.
This is what the new interface looks like :

now you will see the units of the data you are plotting

Plotting some noise
Plotting data from a real sample

