项目作者: leaderj1001

项目描述 :
Implementing Randomly Wired Neural Networks for Image Recognition, Using CIFAR-10 dataset, CIFAR-100 dataset
高级语言: Jupyter Notebook
项目地址: git://github.com/leaderj1001/RandWireNN.git
创建时间: 2019-04-10T06:15:30Z
项目社区:https://github.com/leaderj1001/RandWireNN

开源协议:MIT License

下载


Randomly Wired Neural Network

  • Implement Exploring Randomly Wired Neural Networks for Image Recognition :)

PWC Datasets Datasets

Experiments

Datasets Model Accuracy Epoch Training Time Model Parameters

CIFAR-10 | RandWireNN(4, 0.75), c=78 | 93.61% | 77 | 3h 50m | 4.75M
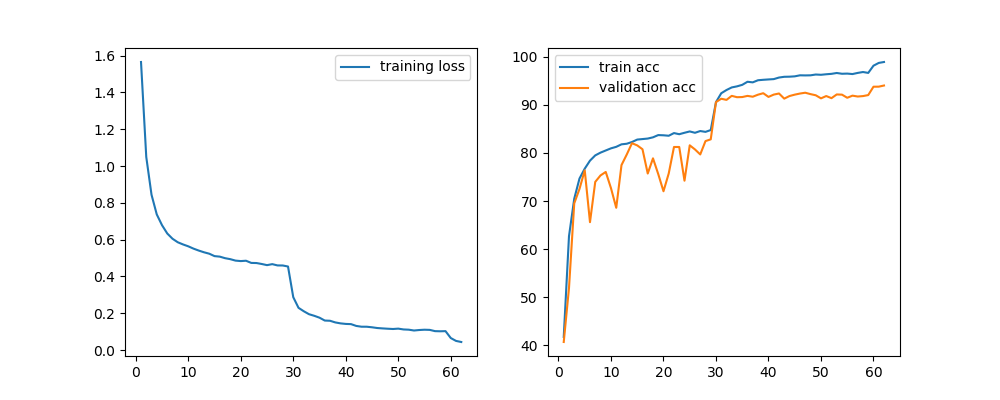
CIFAR-10 | RandWireNN(4, 0.75), c=109 | 94.03% | 62 | 3h 50m | 8.93M
CIFAR-10 | RandWireNN(4, 0.75), c=154 | 94.23% | 94 | 8h 40m | 17.31M
CIFAR-100 | RandWireNN(4, 0.75), c=78 | 73.63% | 97 | 4h 46m | 4.87M
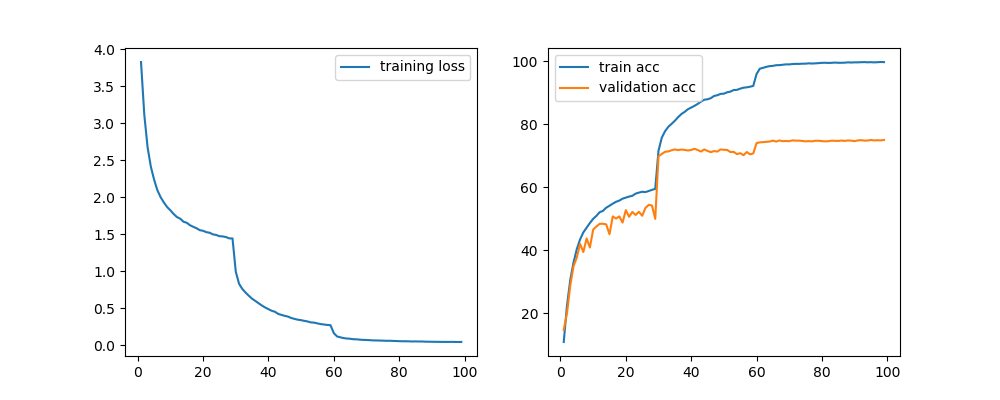
CIFAR-100 | RandWireNN(4, 0.75), c=109 | 75.00% | 99 | 6h 9m | 9.04M
CIFAR-100 | RandWireNN(4, 0.75), c=154 | 75.42% | 99 | 9h 32m | 17.43M
IMAGENET | WORK IN PROGRESS | WORK IN PROGRESS
Update (2019.05.06)

  1. Visualize weights
  2. Add directory of Drop Connection regularization RandWireNN

Update (2019.04.20)

  1. I added graphing functions for train accuracy, test accuracy, and train loss.
  2. I have added a part to report learning time and accuracy. Reporting of the above results can be seen in the reporting folder.

Todo

  • Experiment with Imagenet dataset.
  • To implement Optimzier like the paper.

Plot

CIFAR-10

epoch_acc_plot

CIFAR-100

epoch_acc_plot_75퍼_CIFAR100

Visualize layer

img

  • As each Epoch passes, we can see that the feature map is formed around the object.

Run

  1. python main.py
  • If you want to change hyper-parameters, you can check “python main.py —help”

Options:

  • --epochs (int) - number of epochs, (default: 100).
  • --p (float) - graph probability, (default: 0.75).
  • --c (int) - channel count for each node, (example: 78, 109, 154), (default: 78).
  • --k (int) - each node is connected to k nearest neighbors in ring topology, (default: 4).
  • --m (int) - number of edges to attach from a new node to existing nodes, (default: 5).
  • --graph-mode (str) - kinds of random graph, (exampple: ER, WS, BA), (default: WS).
  • --node-num (int) - number of graph node (default n=32).
  • --learning-rate (float) - learning rate, (default: 1e-1).
  • --model-mode (str) - which network you use, (example: CIFAR10, CIFAR100, SMALL_REGIME, REGULAR_REGIME), (default: CIFAR10).
  • --batch-size (int) - batch size, (default: 100).
  • --dataset-mode (str) - which dataset you use, (example: CIFAR10, CIFAR100, MNIST), (default: CIFAR10).
  • --is-train (bool) - True if training, False if test. (default: True).
  • --load-model (bool) - (default: False).

Test

  1. python test.py
  • Put the saved model file in the checkpoint folder and saved graph file in the saved_graph folder and type “python test.py”.
  • If you want to change hyper-parameters, you can check “python test.py —help”
  • The model file currently in the checkpoint folder is a model with an accuracy of 92.70%.

Options:

  • --p (float) - graph probability, (default: 0.75).
  • --c (int) - channel count for each node, (example: 78, 109, 154), (default: 78).
  • --k (int) - each node is connected to k nearest neighbors in ring topology, (default: 4).
  • --m (int) - number of edges to attach from a new node to existing nodes, (default: 5).
  • --graph-mode (str) - kinds of random graph, (exampple: ER, WS, BA), (default: WS).
  • --node-num (int) - number of graph node (default n=32).
  • --model-mode (str) - which network you use, (example: CIFAR10, CIFAR100, SMALL_REGIME, REGULAR_REGIME), (default: CIFAR10).
  • --batch-size (int) - batch size, (default: 100).
  • --dataset-mode (str) - which dataset you use, (example: CIFAR10, CIFAR100, MNIST), (default: CIFAR10).
  • --is-train (bool) - True if training, False if test. (default: False).

Reference

Methods

  • Erdos-Renyi (ER) Graph, Watts-Strogatz (WS) Graph and Barabasi-Albert (BA) Graph are all available.
  • If you want to visualize the network connection, you can follow the jupyter notebook in visualize_graph directory.
  • Label smoothing.
    • In CIFAR-10, The accuracy was 92.00%.
    • But, CIFAR-100, I have seen improvements in CIFAR-100.

Version

  • Windows 10, Pycharm community…
  • Python 3.7
  • Cuda 9.2
  • Cudnn 7.1.4
  • pytorch 1.0.1
  • networkx 2.2
  • torchviz 0.0.1
  • graphviz 0.10.1
  • tqdm 4.31.1
  • conda install cairo(If you want to visualize the network, it is a required module.)

Network Image

Small Network Image

  • It is a picture of the sample small network in the visualize_graph directory.
  • When I draw the contents of “Exploring Randomly Wired Neural Networks for Image Recognition” on the network, too many nodes are created. So I tried to draw a small network for visualization.
    • Number of nodes: 7
    • Graph parameters(probability P): 0.4
    • Random seed: 12
    • In_channels: 2
    • Out_channels: 2
  • The following figure is a simple example, and the basic RandWired NeuralNetwork Module is provided.

Example of Network

image