Data Table 🈸 for Notebook 📓 cell ⌗ data outputs.

See Data Preview 🈸 vscode extension for a generic Grid Data Viewer with many common data formats support, search, sort, filters, grouping, splits, pivot tables, aggregates and basic charts 📊.
These Data Table Renderers were created to enhance raw data views in Jupyter and custom VSCode Notebooks 📚.
Please consider becoming a Fan and sponsoring our dev efforts on this and other Random Fractals, Inc. code and data viz extensions if you find them useful, educational, or enhancing your daily dataViz/dev code workflows and exploratory data analysis:
☕️ https://ko-fi.com/dataPixy
💖 https://github.com/sponsors/RandomFractals
Data Table Renderers is a collection of custom tabular data renderers for vscode notebooks.
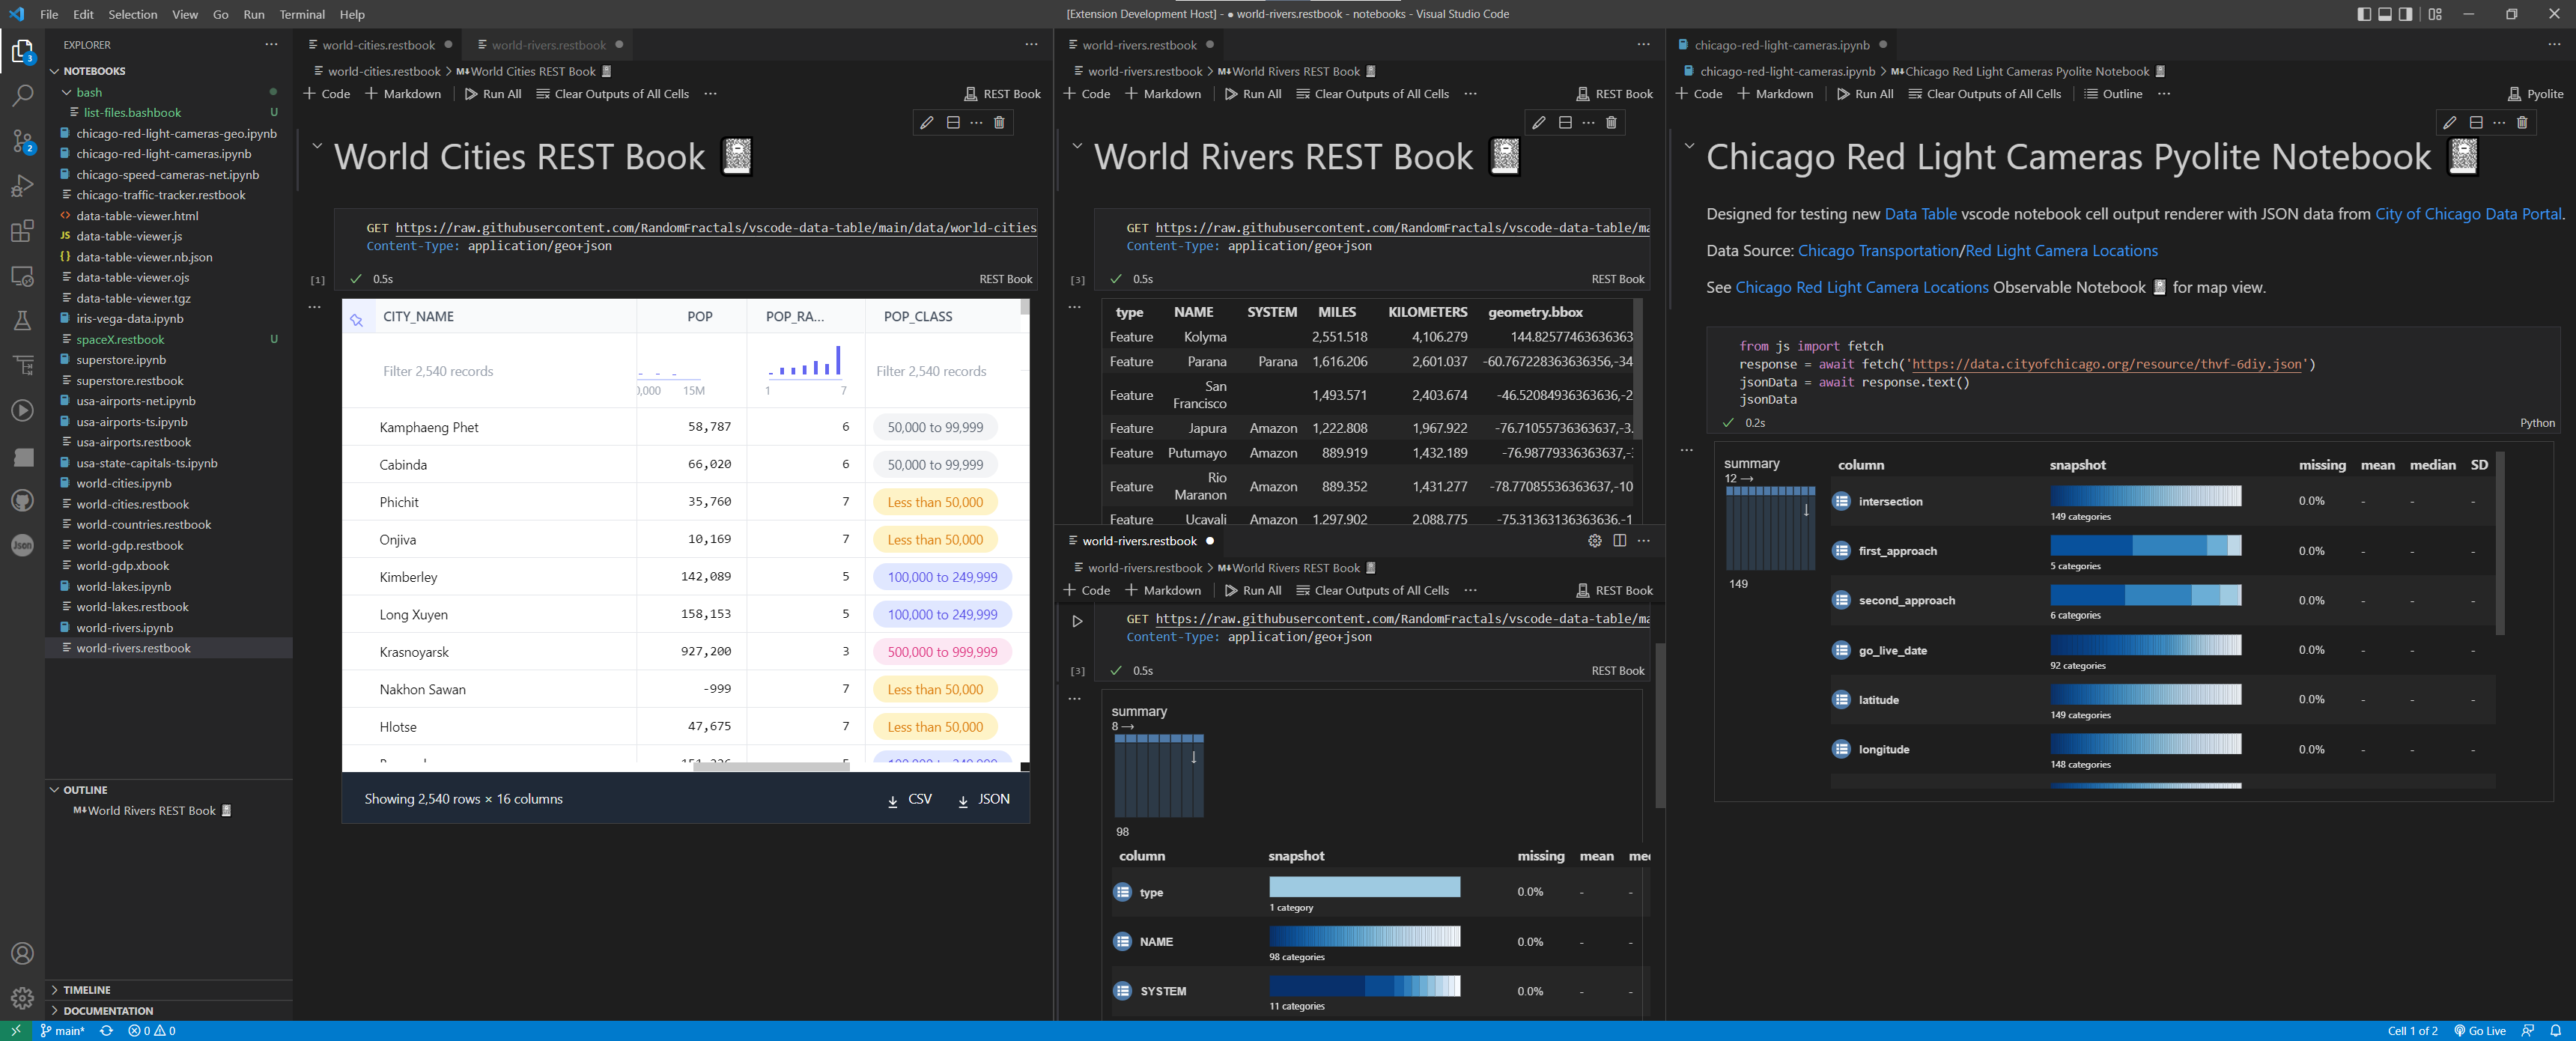
CSV, semi-flat XML, GeoJSON and JSON array data Notebook 📓 cell ⌗ output in HTML table with column sort, number and date formattingCSV save options
Data Table 🈸 Notebook 📓 cell ⌗ output renderer uses Observable Inputs Table component for fast incremental data display and scrolling of datasets loaded in VSCode Notebooks 📚

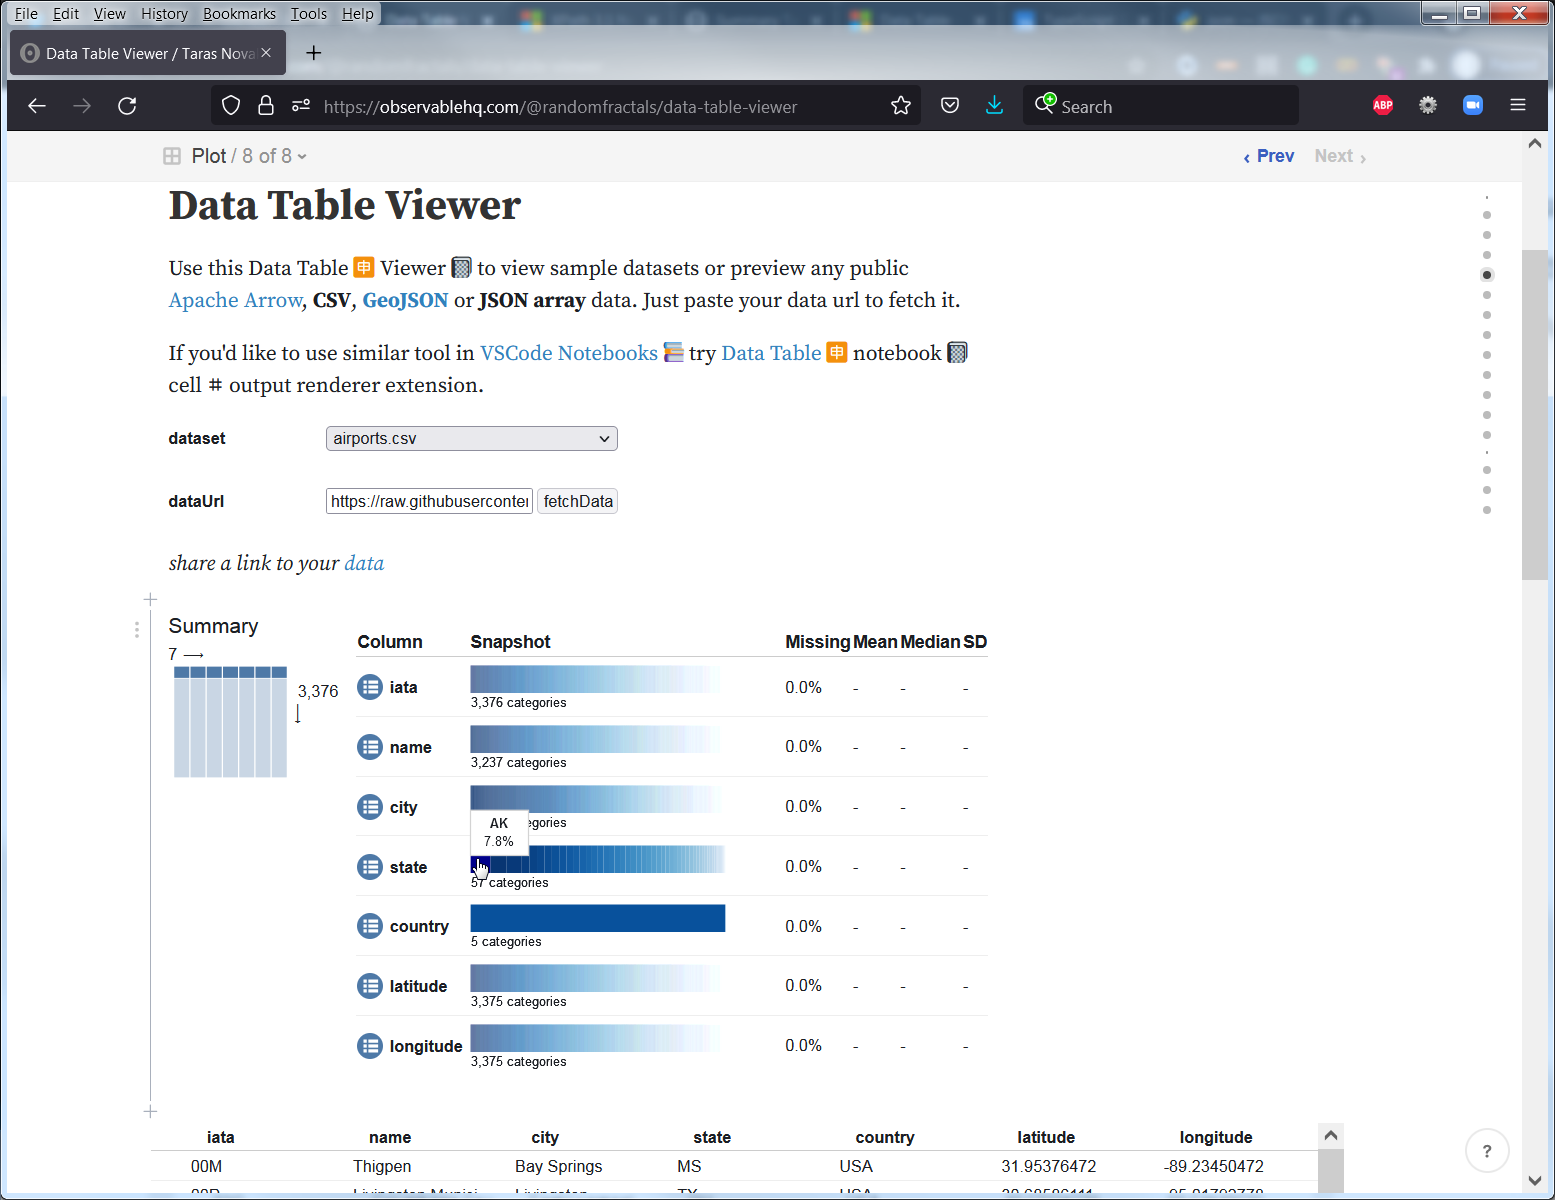
You can also use our generic @randomfractals/data-table-viewer">Data Table Viewer 📓 notebook to preview public datasets in a browser:
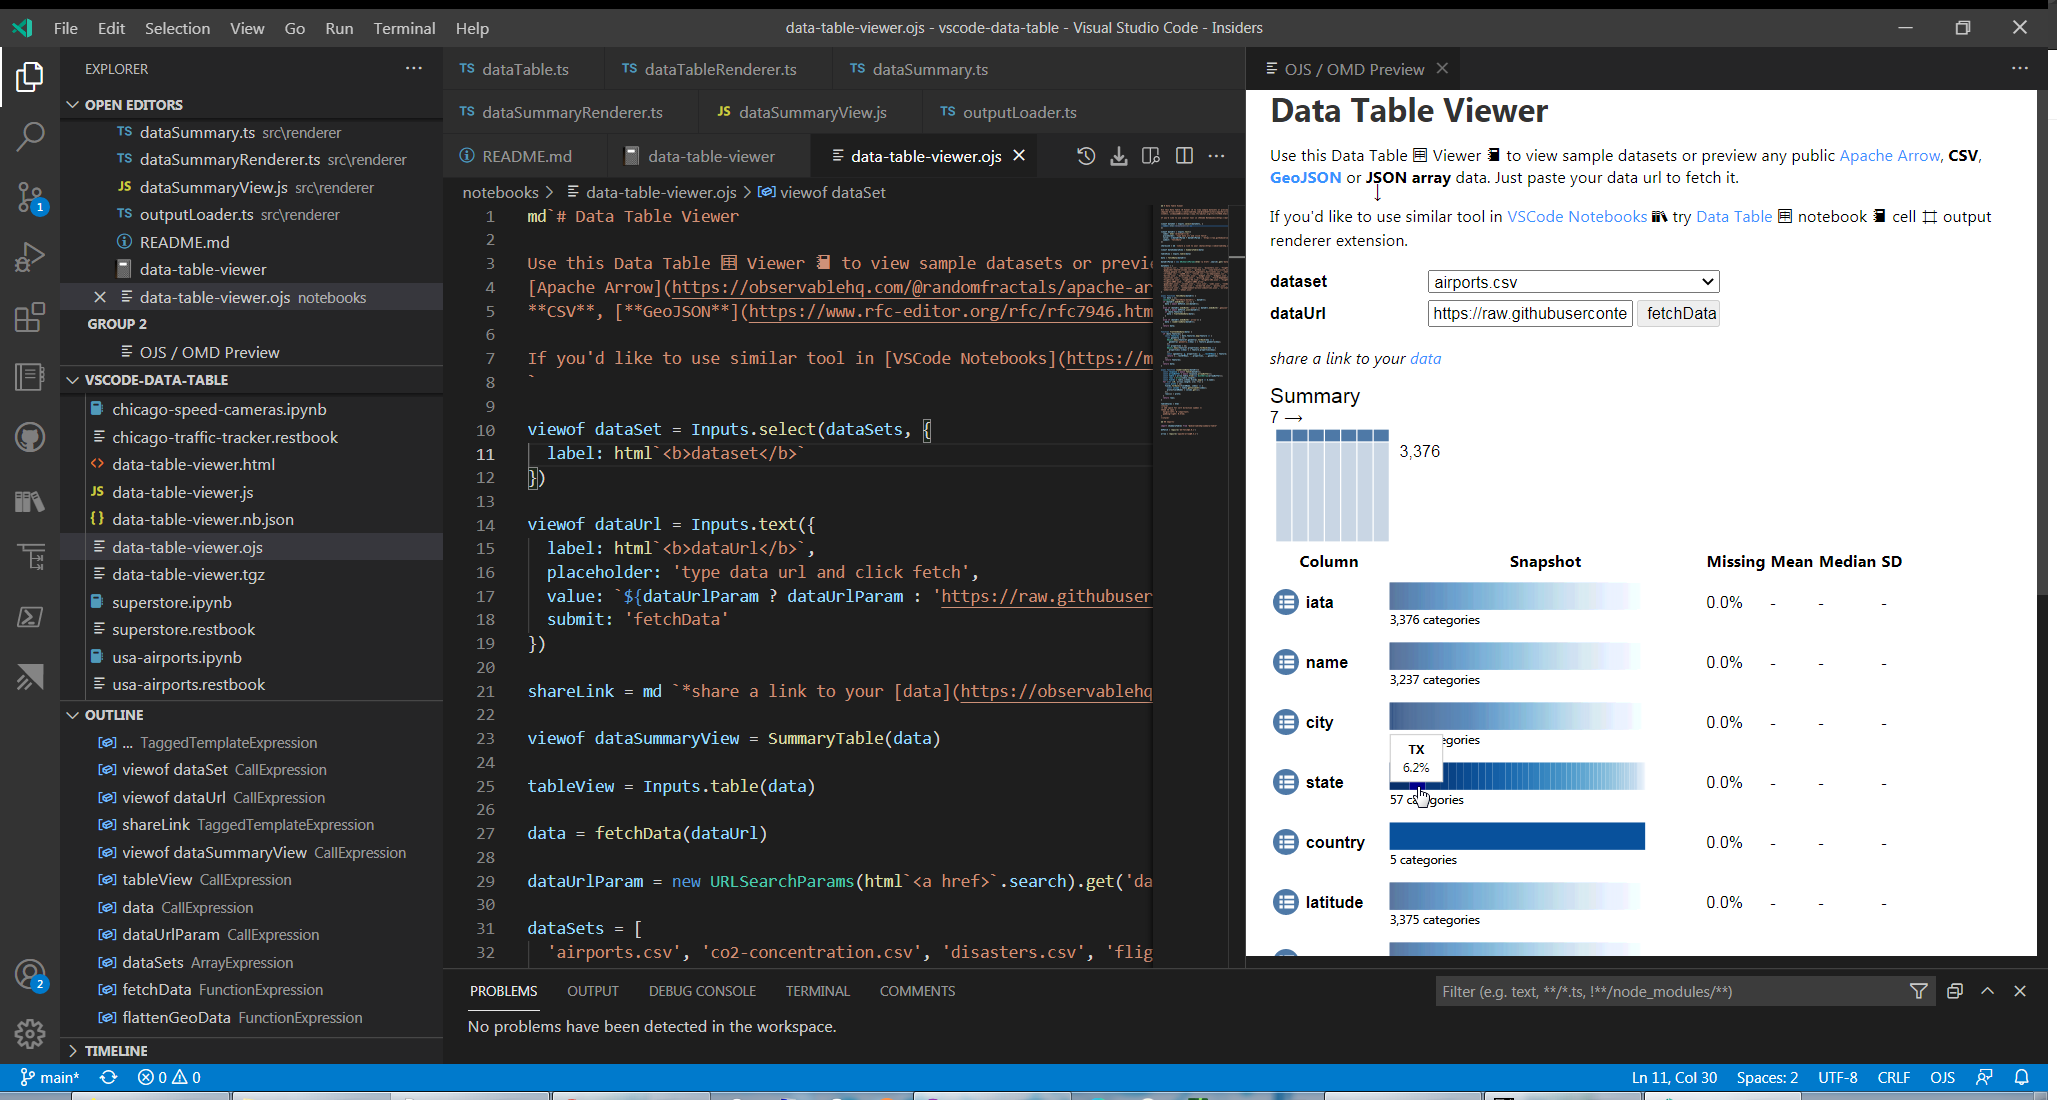
Or use it in vscode with Observable JS Notebook 📓 Inspector 🕵️:

Or load Data Table 🈸 Viewer 📓 with Observable JS vscode extension:
This general purpose Data Table 🈸 Renderer extension also includes Data Summary 📊 Renderer based on modifield @observablehq/summary-table">Observable Summary Table component for a quick overview of datasets loaded in VSCode Notebooks 📚

Flat Data Grid renderer is the latest addition to this custom tabular data renderers collection vscode extension. It’s based on the Flat UI React data grid component library created by the GitHub Next dev team & used in Flat Data viewer on flatgithub.com.
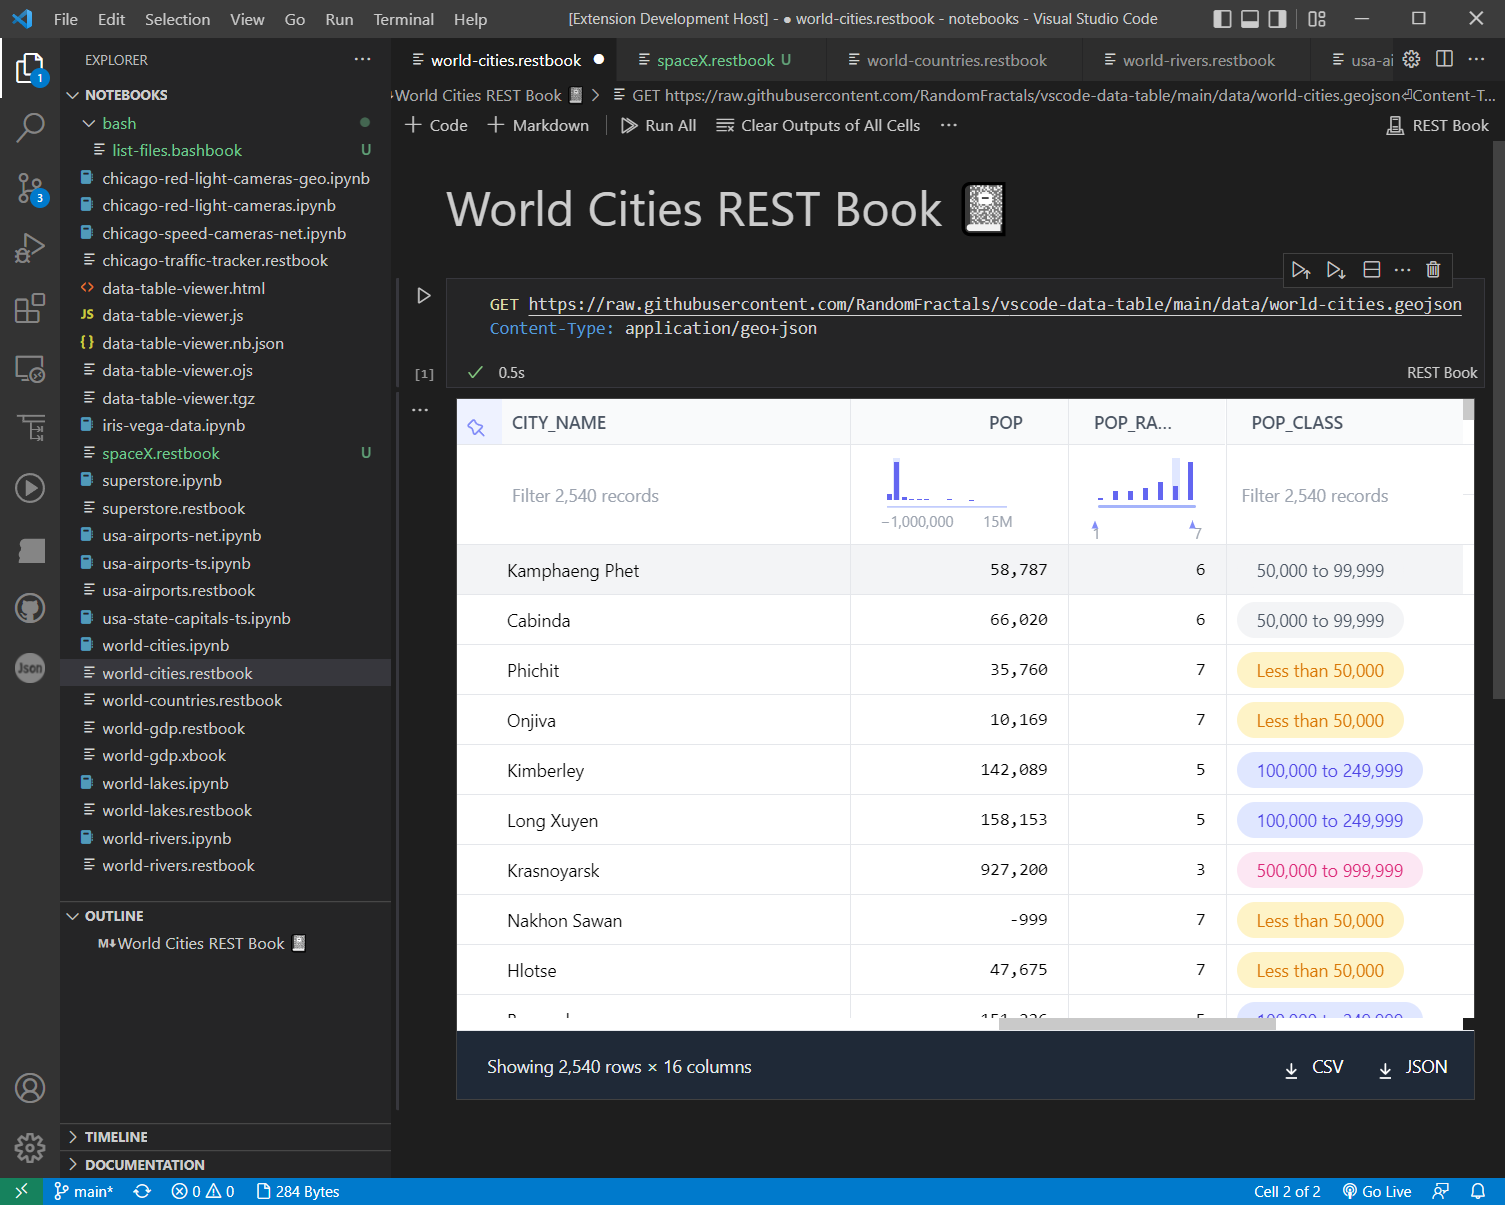
Data Table 🈸 for Notebooks 📚 extension v1.6.0 and up ships with built-in Notebook examples. You can access provided Notebook Examples listed below via Data Table: Notebook Examples command from View -> Command Palette... vscode menu:

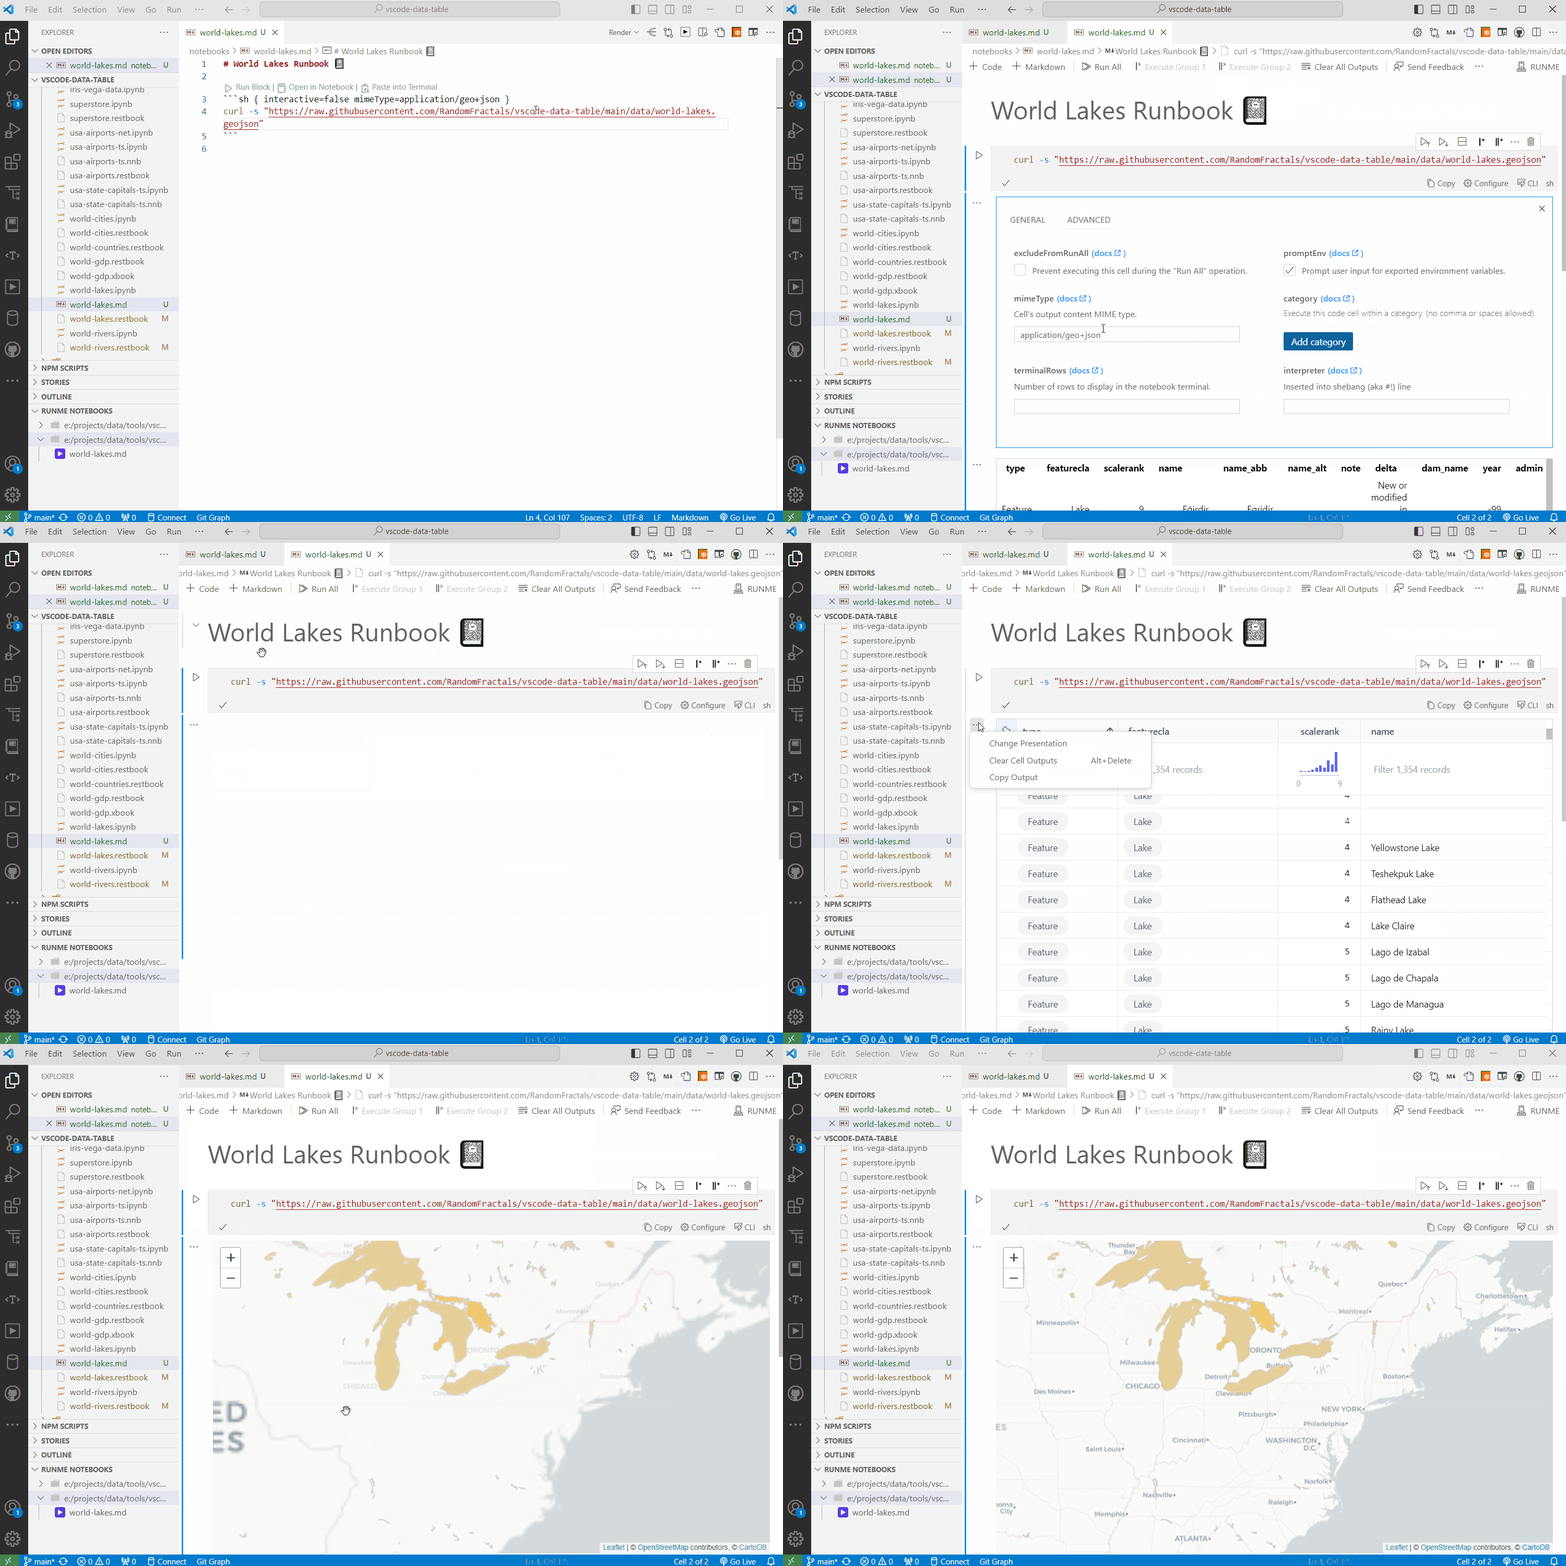
Install Runme vscode extension
Load notebooks/world-lakes.md document
Click on ▶️ in the markdown text editor context menu to Open markdown as Runme 📓.
Run All ᐅ cells ⌗
Click on ... in the gutter of the curl command cell and Change Presentation to one of the Data Table 🈸 renderers or Leaflet 🍃 Map 🗺️ renderer:
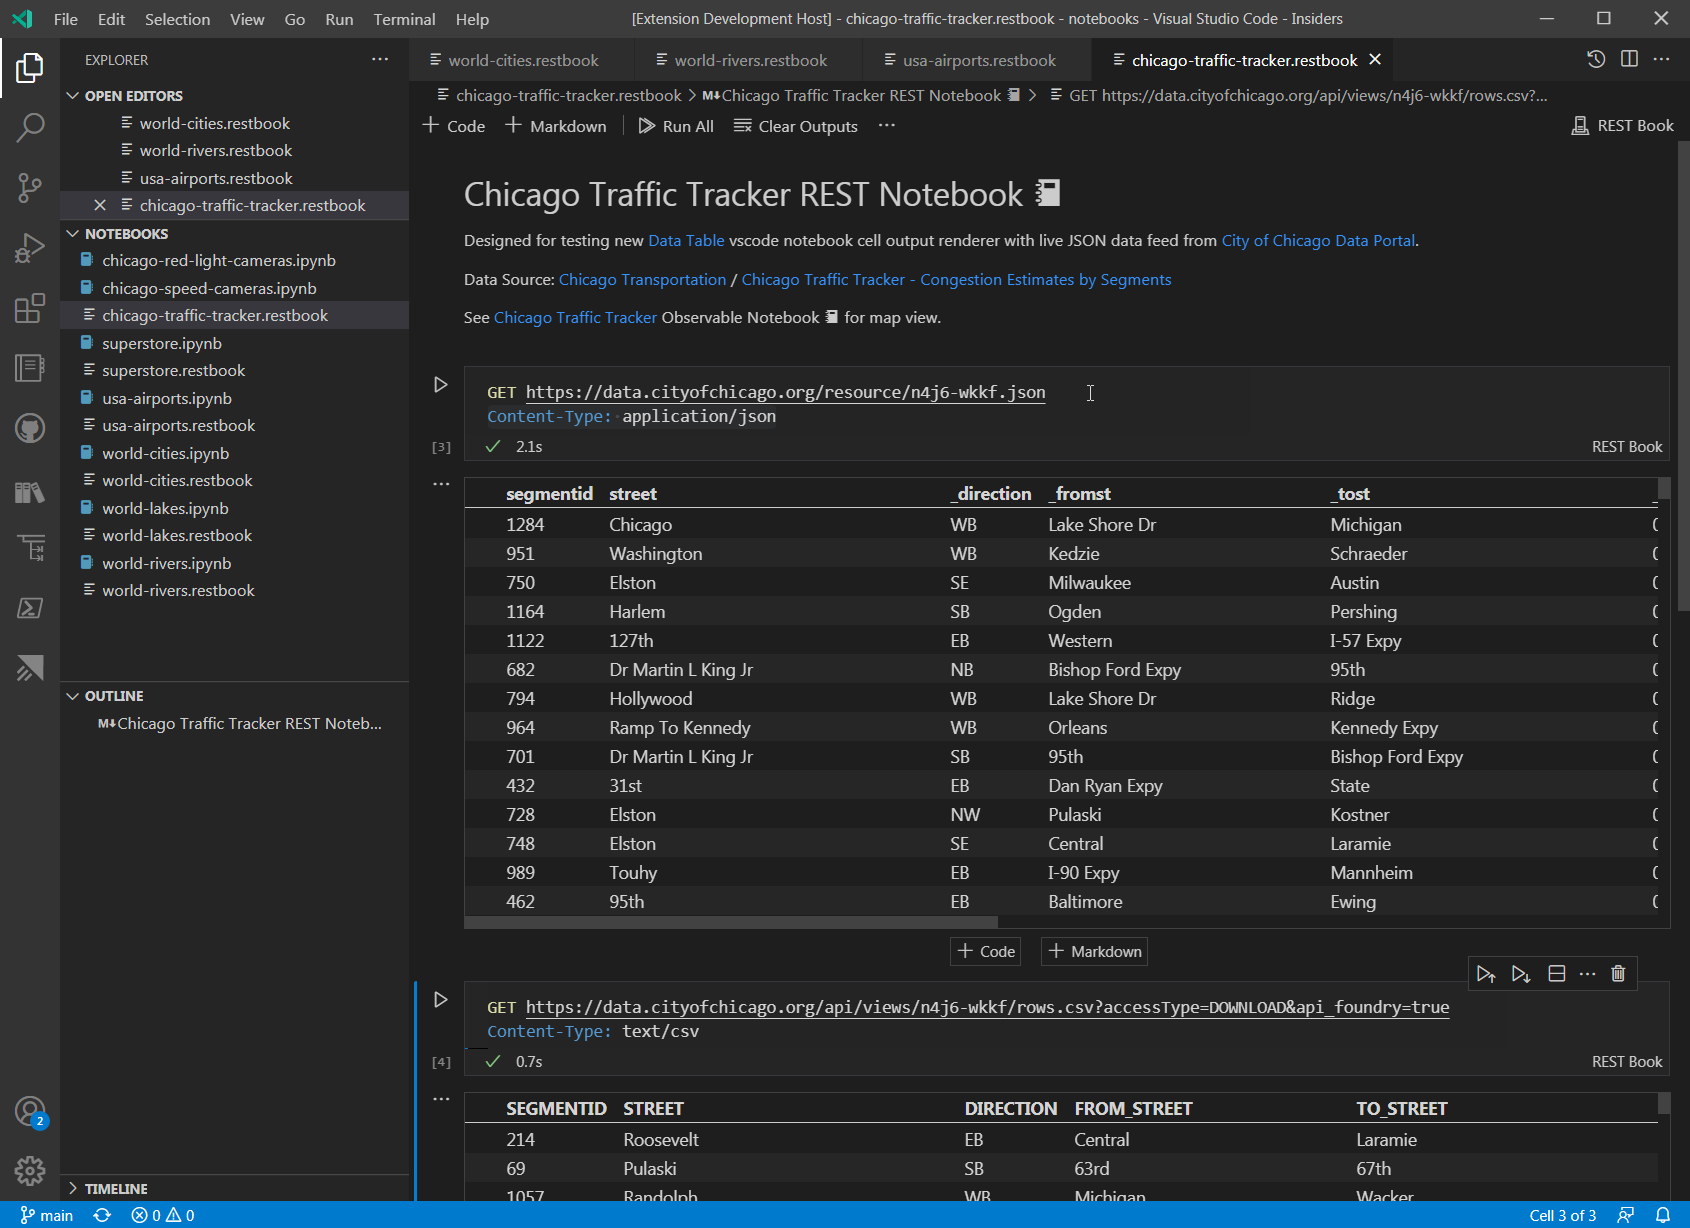
Install REST Book 📓 vscode extension
Load Chicago Traffic Tracker REST Book 📓
Run All ᐅ cells ⌗
Click on ... in the gutter of GET data output and change it to Data Table 🈸 renderer:
vega_datasets and altair Python libraries via pip or conda:
$ pip install altair vega_datasets
or
$ conda install -c conda-forge altair vega_datasets
Load Iris Vega Data Python 🐍 Notebook 📓
Run All ᐅ cells ⌗
Click on ... in the gutter of iris data output and change it to Data Table 🈸 renderer:
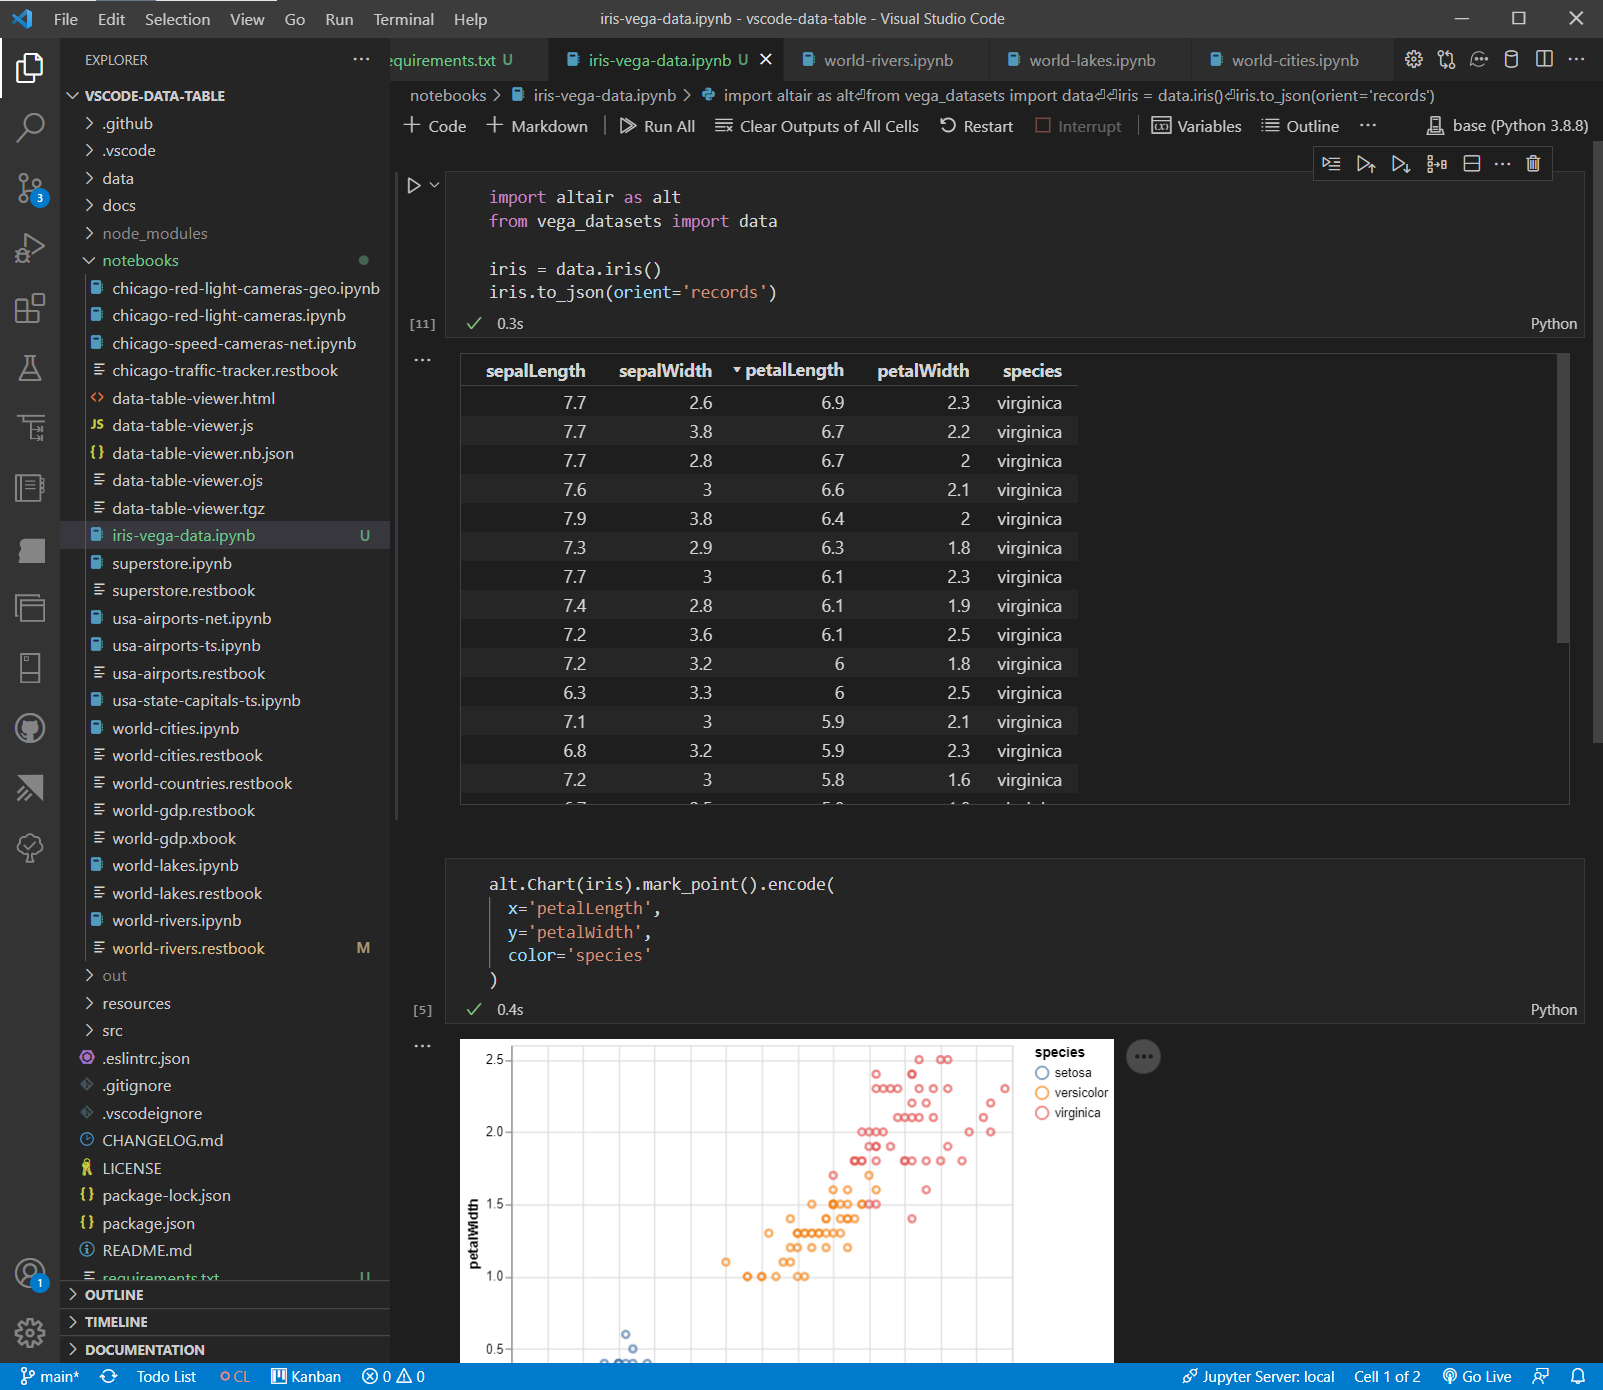
or switch it to Data Summary 🈷️ renderer:

Install TypeScript Notebooks 📚 vscode extension
Download USA Airports data files
Load USA Airports TypeScript Notebook 📓
Run All ᐅ cells ⌗ to view local CSV and JSON text data outputs with Data Table 🈸:
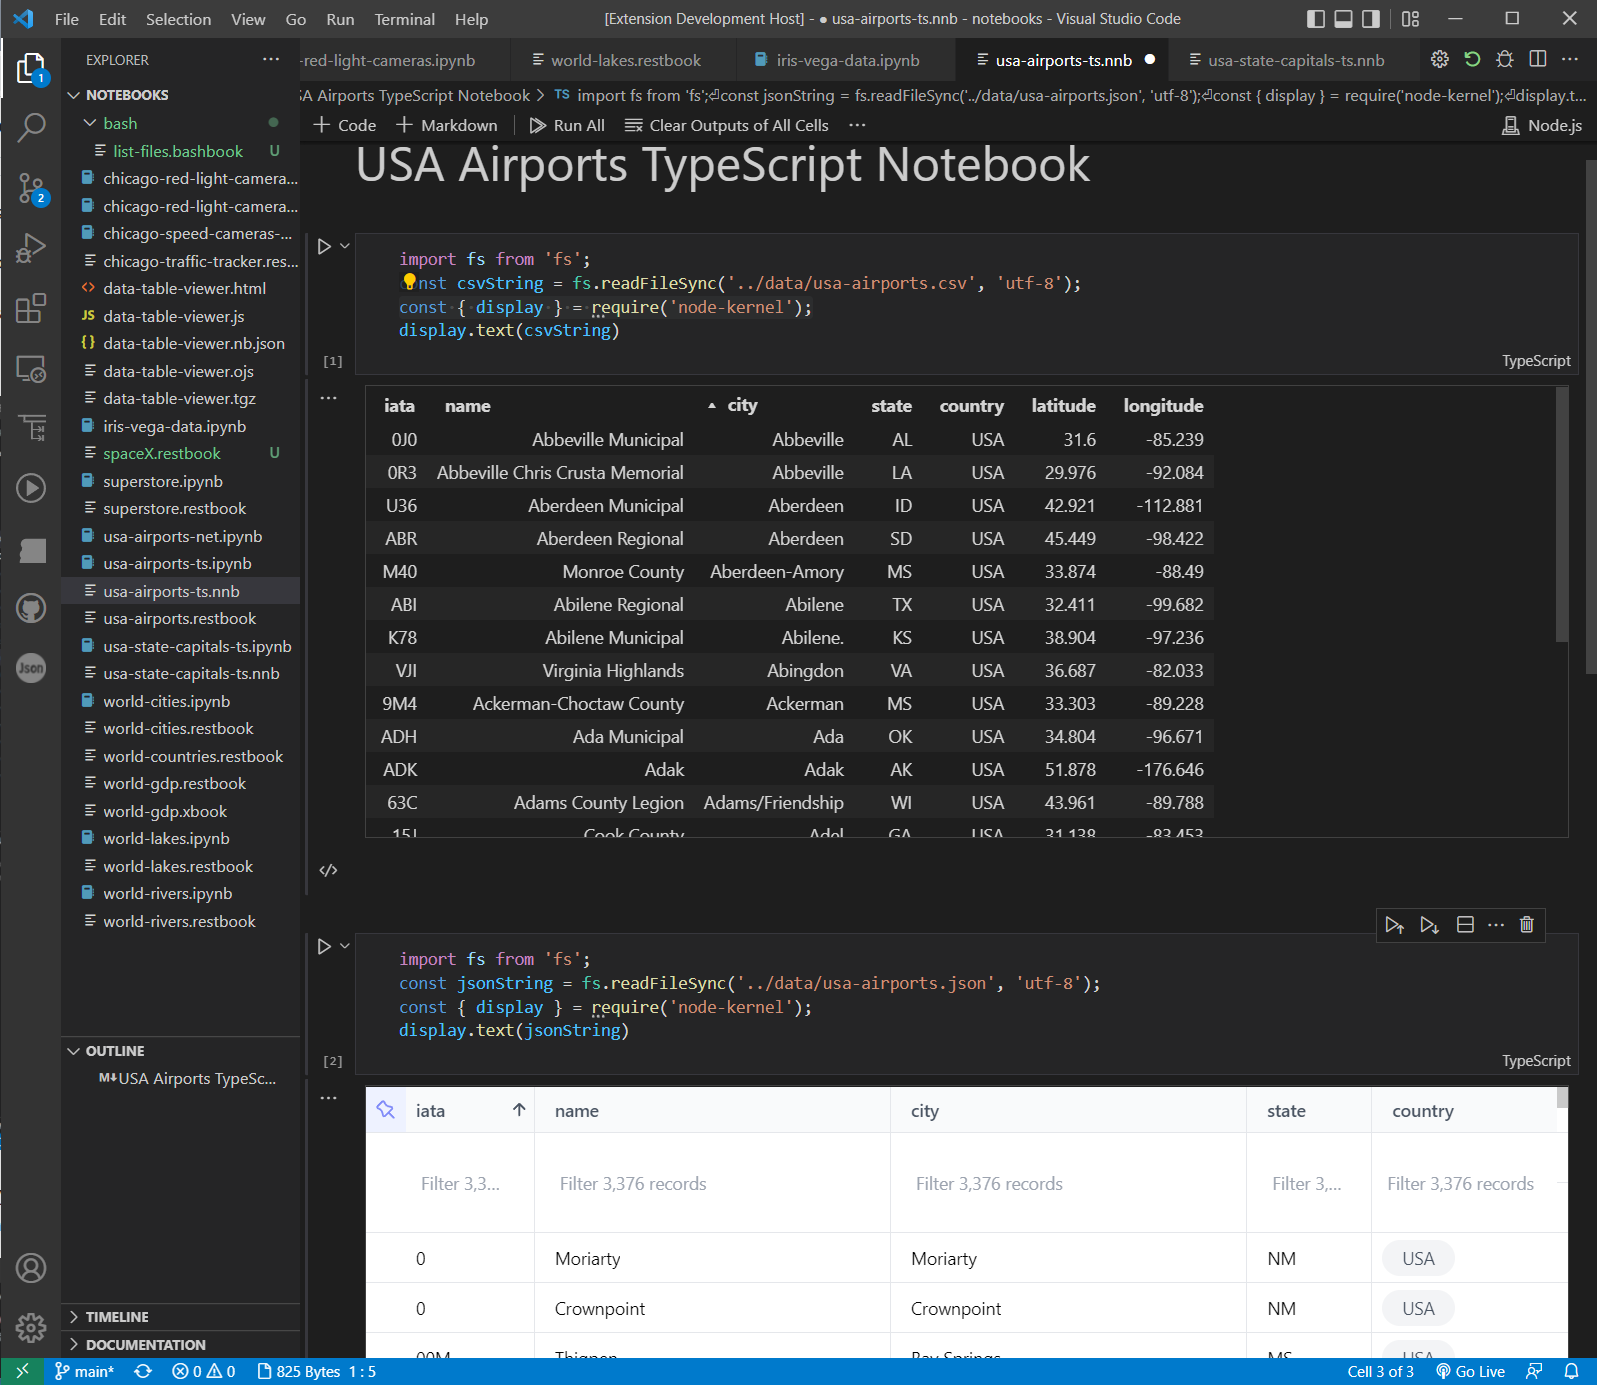
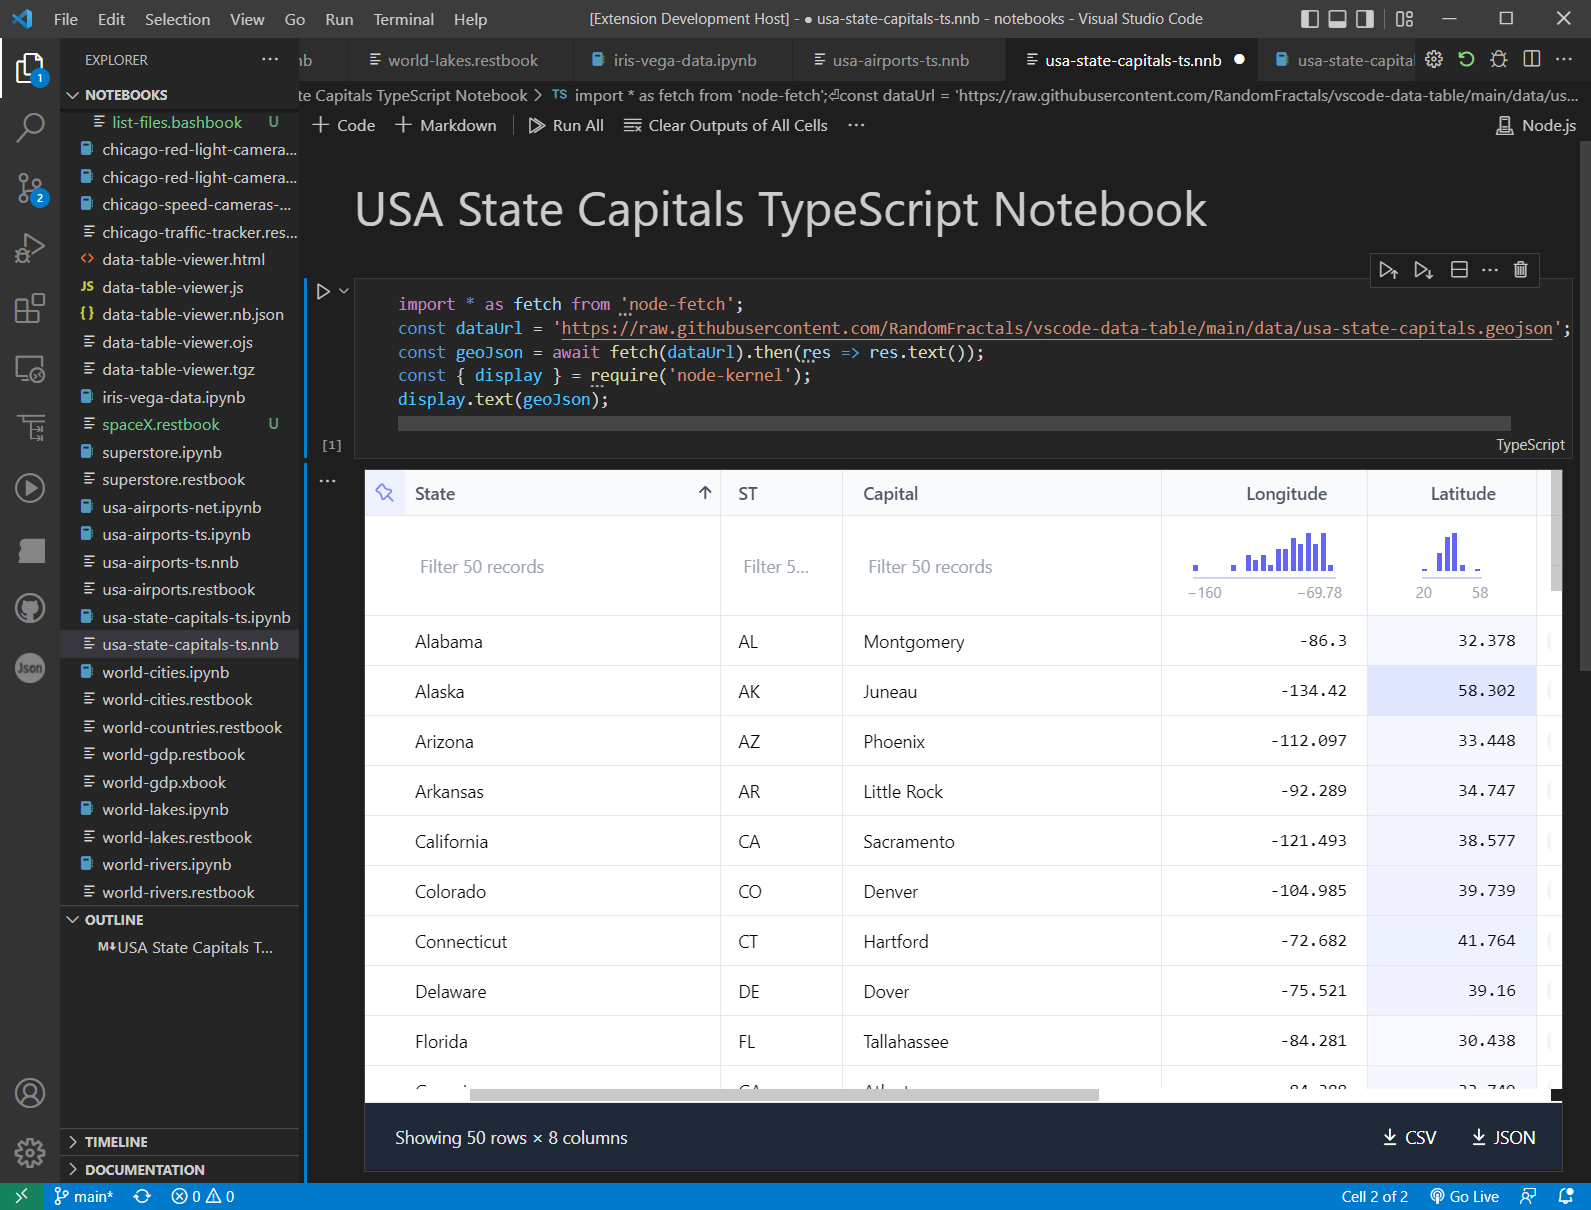
Also, try new USA State Capitals TypesScript Notebook 📓 with GeoJSON node-fetch and Flat Data Grid renderer from built-in Notebook Examples:
Install .NET Install Tool for Extension Authors vscode extension
Install .NET Interactive Notebooks 📚 vscode extension
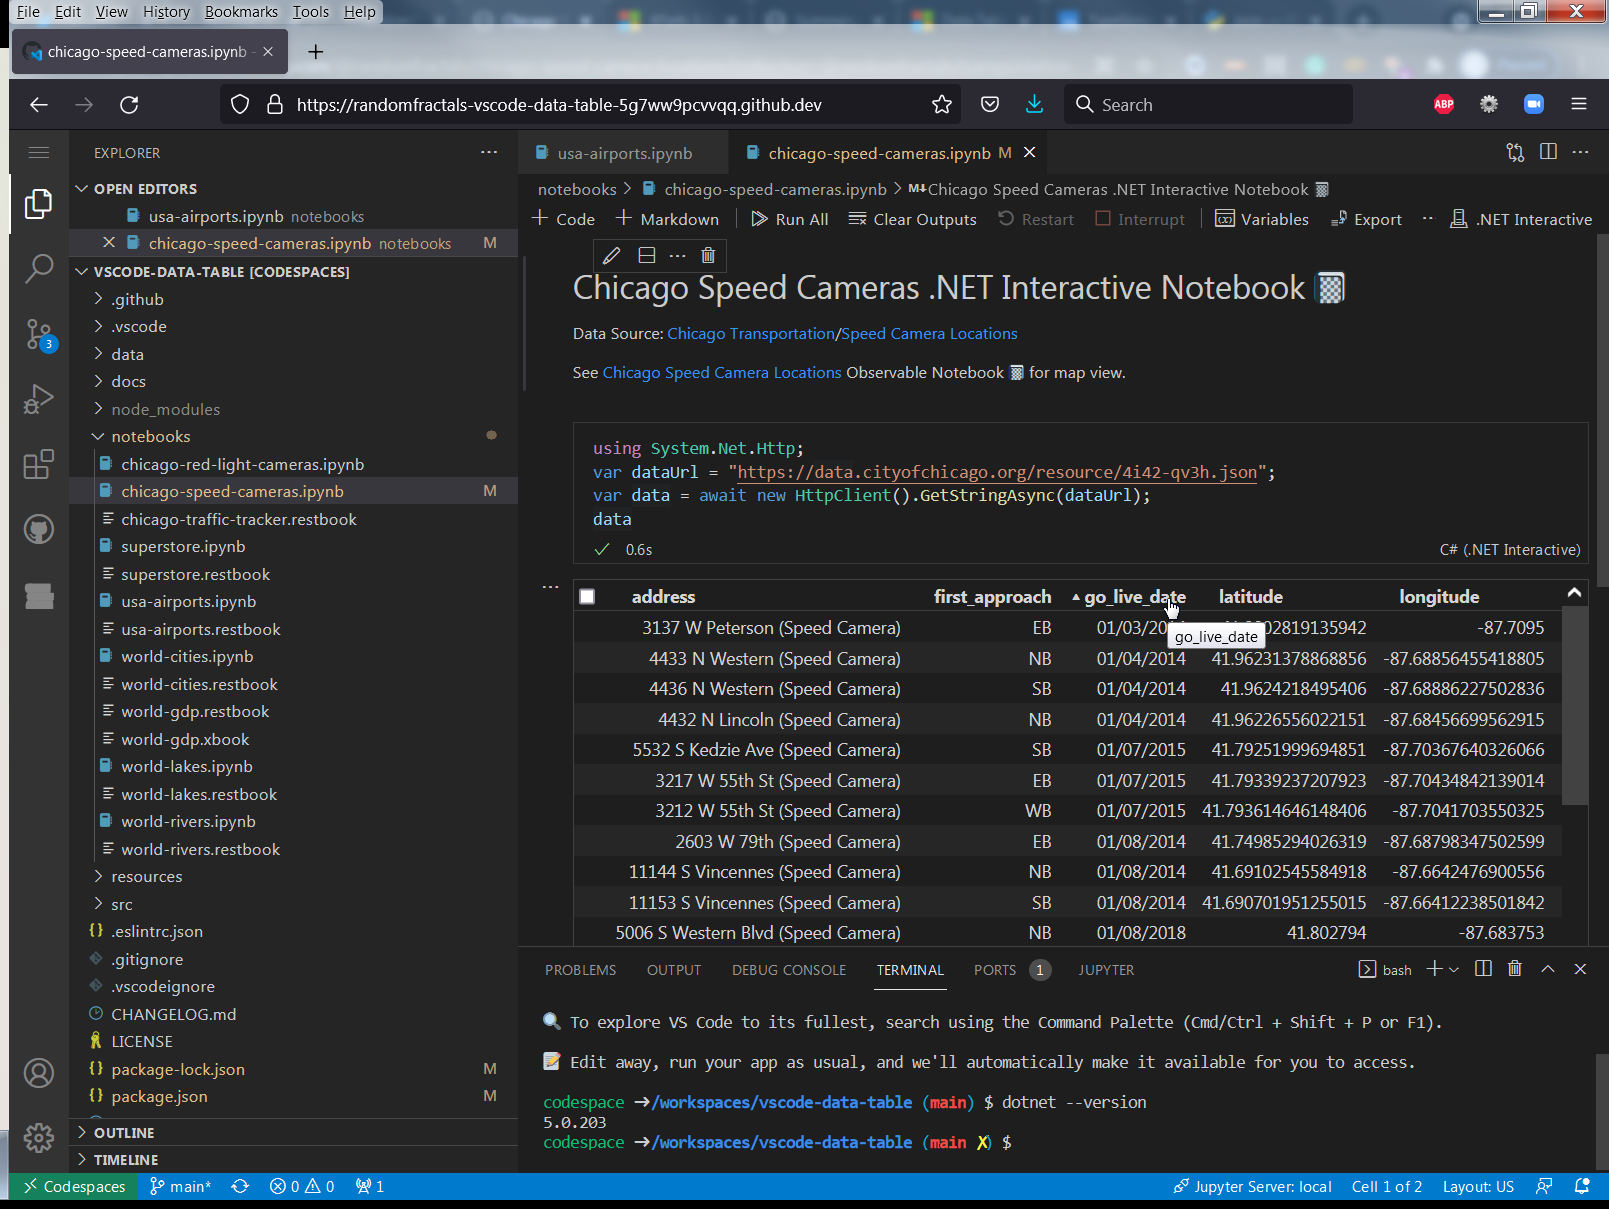
Load Chicago Speed Cameras .NET Interactive Notebook 📓
Run All ᐅ cells ⌗:
Install Pyodide 🐍 vscode extension
Load Chicago Red Light Cameras Pyolite Notebook 📓
Run All ᐅ cells ⌗:

Install REST Book 📓 vscode extension
Load World 🌐 Rivers REST Book 📓
Run All ᐅ cells ⌗
Click on ... in the gutter of GET data output and change it to Data Table 🈸 for geo table view:

Load World 🌐 GDP REST Book 📓
Run All ᐅ cells ⌗
Click on ... in the gutter of GET data output and change it to Data Table 🈸 for XML data table view:
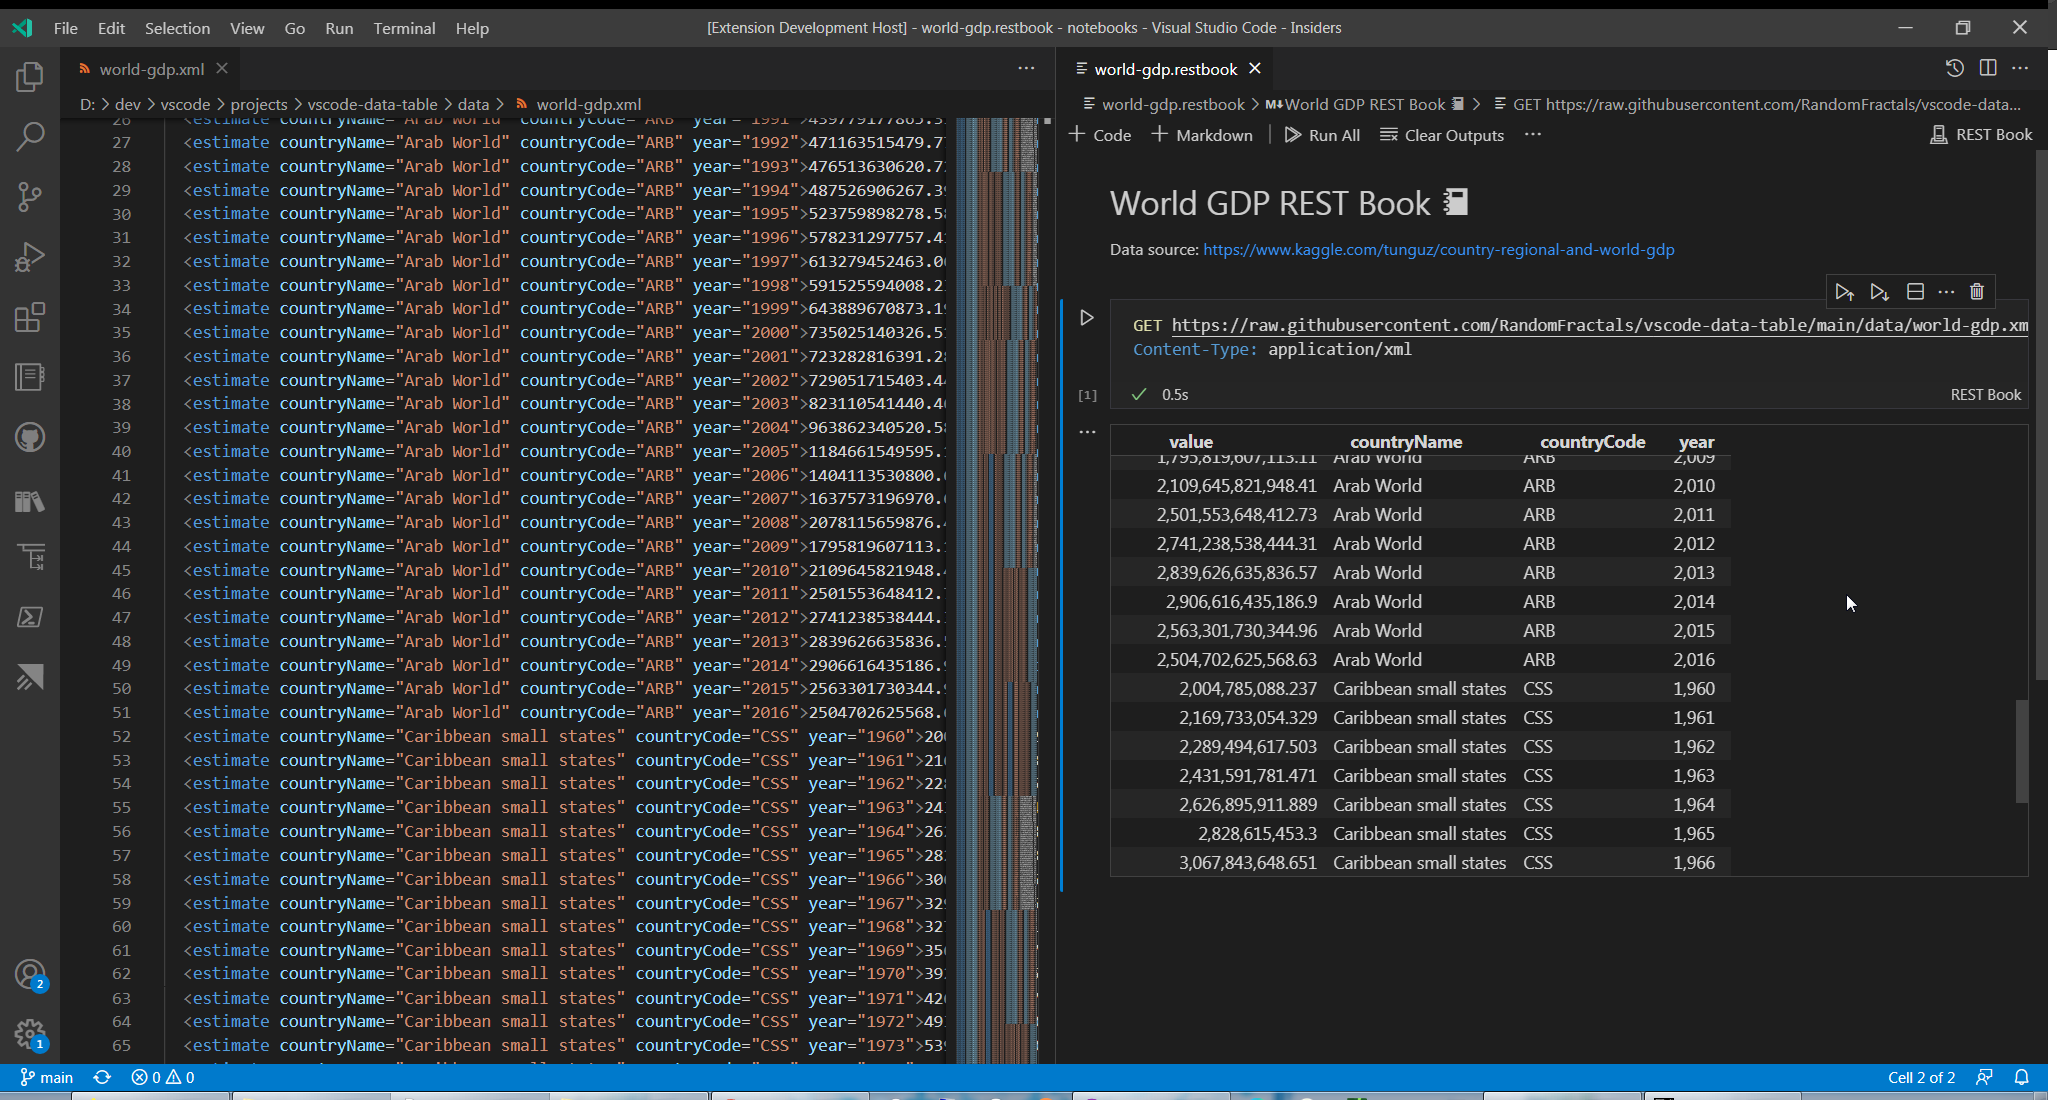
Data Table 🈸 renderer displays data that is not in CSV, GeoJSON or JSON array data format in a scrollable text container:
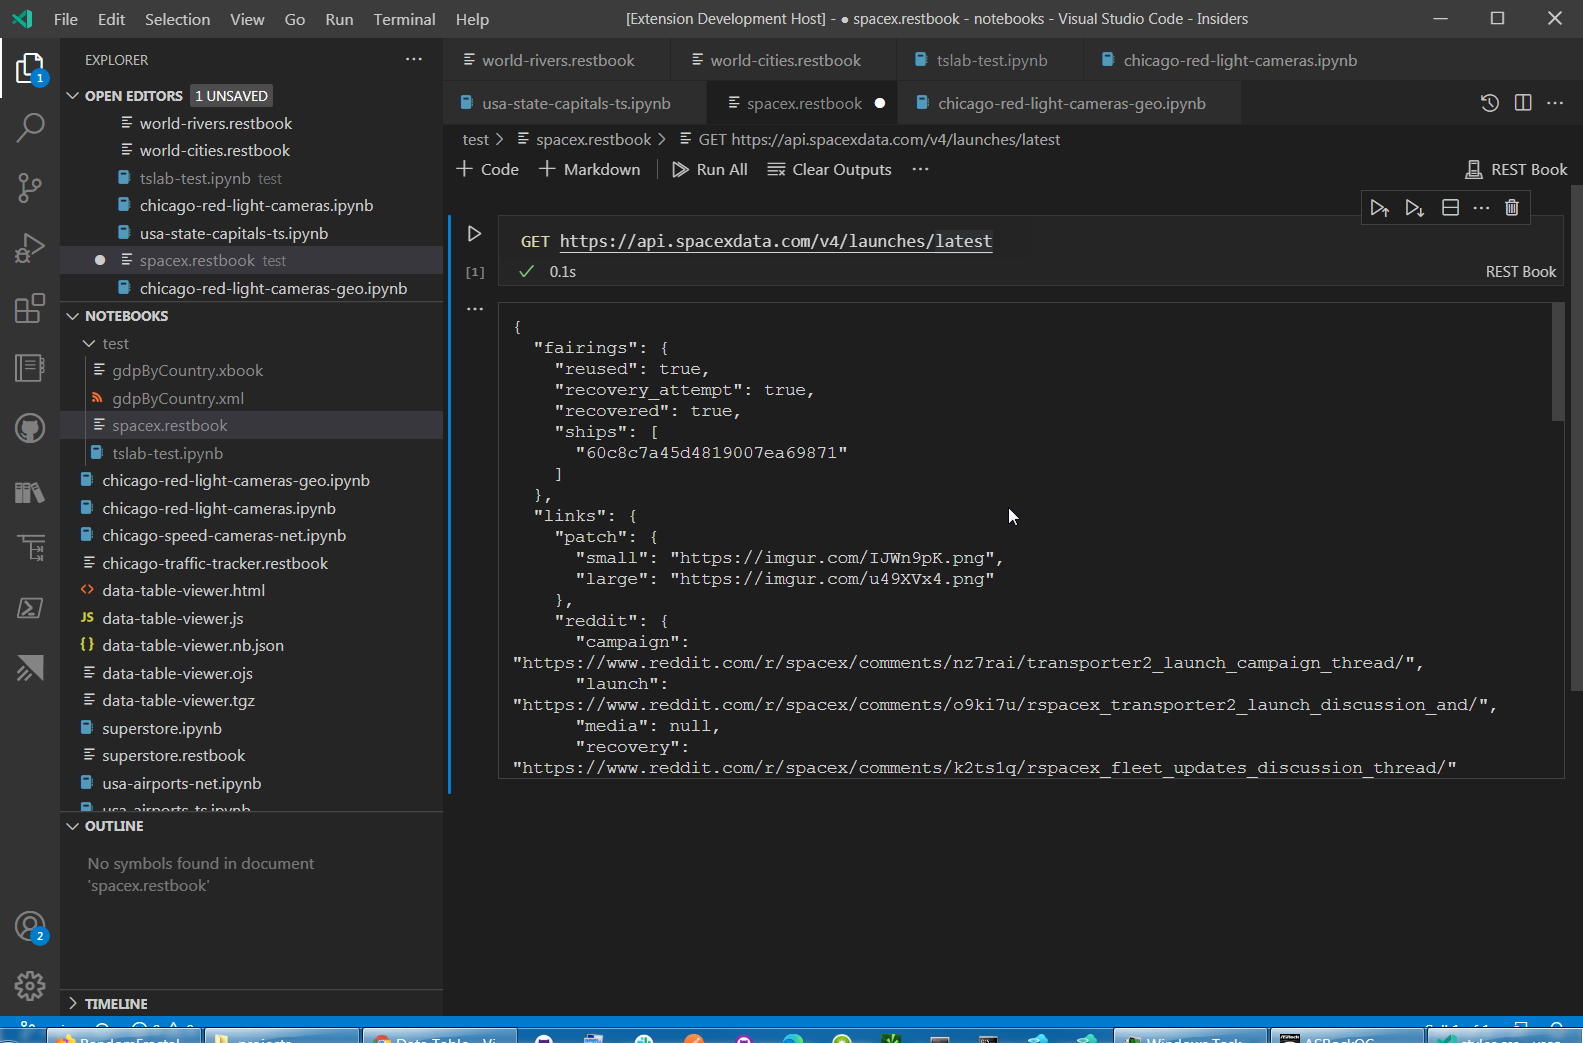
You can add our Data Table 🈸 Notebook 📓 Renderers dependency to your custom VSCode notebook kernels to enable users of your custom notebooks to view data with our Data Table renderers by declaring extension dependency in your VSCode extension package.json:
"extensionDependencies": ["RandomFractalsInc.vscode-data-table"],
See VSCode Extension Manifest doc for more info.
Recommended extensions for working with Interactive Notebooks 📚, data 🈸, charts 📈, and geo 🗺️ data formats in VSCode:
| Extension | Description |
|---|---|
| Data Preivew 🈸 | Data Preview 🈸 extension for importing 📤 viewing 🔎 slicing 🔪 dicing 🎲 charting 📊 & exporting 📥 large JSON array/config, YAML, Apache Arrow, Avro & Excel data files |
| Geo Data Viewer 🗺️ | kepler.gl Geo Data Analytics tool to gen. some snazzy 🗺️s w/0 Py 🐍 pyWidgets ⚙️ pandas 🐼 or react ⚛️ |
| Vega Viewer 📈 | Provides Interactive Preview of Vega & Vega-Lite maps 🗺️ & graphs 📈 |
| Leaflet 🍃 Map 🗺️ | Leaflet 🍃 Map 🗺️ for Notebook 📓 cell ⌗ data outputs |
| JS Notebook 📓 Inspector 🕵️ | Provides Interactive Preview of Observable JS Notebooks 📚, Notebook 📓 nodes ⎇ & cells ⌗ source code |
| Observable JS | Observable Notebooks 📚 Interpreter with VSCode Notebook view support, @observablehq/observable-for-jupyter-users?collection=@observablehq/observable-for-jupyter-users">Observable js and md code outlines and previews |
| Runme ▶️ | Runme executes commands and code blocks from markdown documents, and provides direct CLI integration and multi-language support in Visual Studio Code markdown text editor and markdown-based notebooks. |
| DeltaXML XPath Notebook | XPath 3.1 Notebook 📓 for Visual Studio Code |
See #DataTableView 🈸 & #DataTableRenderers tags on our Twitter feed for the latest & greatest updates on this vscode extension & what’s next in store for new data tools in vscode.
$ git clone https://github.com/RandomFractals/vscode-data-table$ cd vscode-data-table$ npm install$ npm run compile$ code .
F5 to launch Data Table extension VSCode debug session.
||
vscode-data-table>vsce package
to generate VSIX Data Table extension package with vsce from our latest for local dev install in VSCode.
Any and all test, code or feedback contributions are welcome.
Open an issue or create a pull request to make this Data Table 🈸 Renderers vscode notebooks 📚 extension work better for all.