用于Raspberry PI的智能能源使用仪表

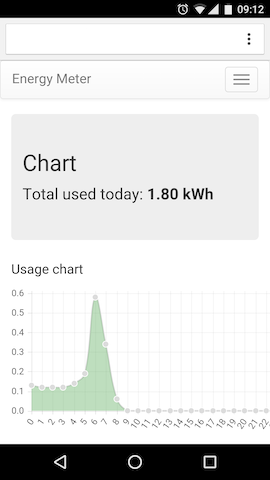
This projects has everything you need to start monitoring and recording your electric energy usage with a Raspberry PI and Arduino. You get easy access to a mobile-friendly daily graph and all-time stats.
It is completely non-intrusive and works by watching the blinks given out by a house-hold electric meter. Each blink of the supplier’s meter will represent 0.001kWh of energy usage. We use a cheap Arduino nano (clone or genuine) to monitor blnks, then a Raspberry PI runs a rich web interface with daily graphs showing peaks and troughs.
npm install bower -gnpm installbower install
If your Raspberry PI has less than 512MB RAM you may want to enable a swapfile due to memory needed when building SQLite
node app starts the program, navigate to http://localhost/ or the IP address of the PI.
Initialize the empty energy DB with the following command: sqlite3 energy.db < provision.sql
meter/meter.py program. This will then start logging data from the Arduino.I have run this system at my own house for over a year and have had no issues to speak of. It has been interesting to monitor the usage of various appliances and what causes a peak and what my daily usage is like.
Copyright Alex Ellis 2016