Monitored Multiprocessing Queues


mnqueues stands for Monitored Queues - a coupling between Python multiprocessing Queue() and a Monitor entity. A Monitor collect and alerts on Queue usage statistics.
mnqueues tracks several measures per queue:
To install mnqueues type:
pip install mnqueues
To create a monitored queue:
import mnqueues as mnqfrom mnqueues.gcp_monitor import GCPMonitorq = mnq.MNQueue(monitor=GCPMonitor("some-unique-name"))
The MNQueue() object encapsulated Python multiprocessing.Queue() and supports same functions. The MNQueue() object can be passed between processes, like a Queue() object.
from mnqueues.log_monitor import LOGMonitormonitor = LOGMonitor("log-file-name")
Log all put() and get() calls to a log file with the the name log-file-name.log with the following format:
[<OS process-id>]->2021-07-07 21:31:14 INFO:get counter: 5003[<OS process-id>]->2021-07-07 21:31:14 INFO:get counter: 4997
from mnqueues.gcp_monitor import GCPMonitormonitor = GCPMonitor("unique-name")
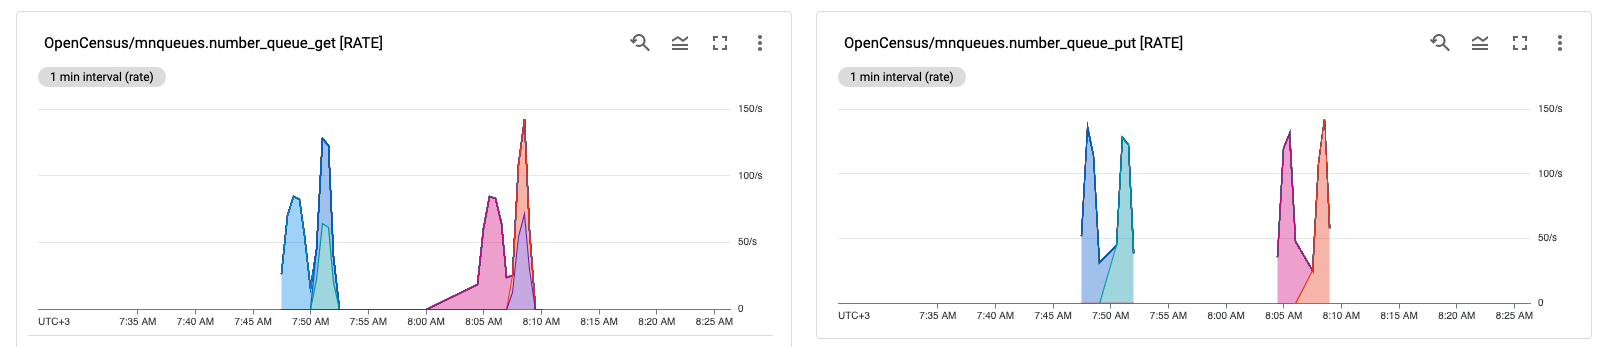
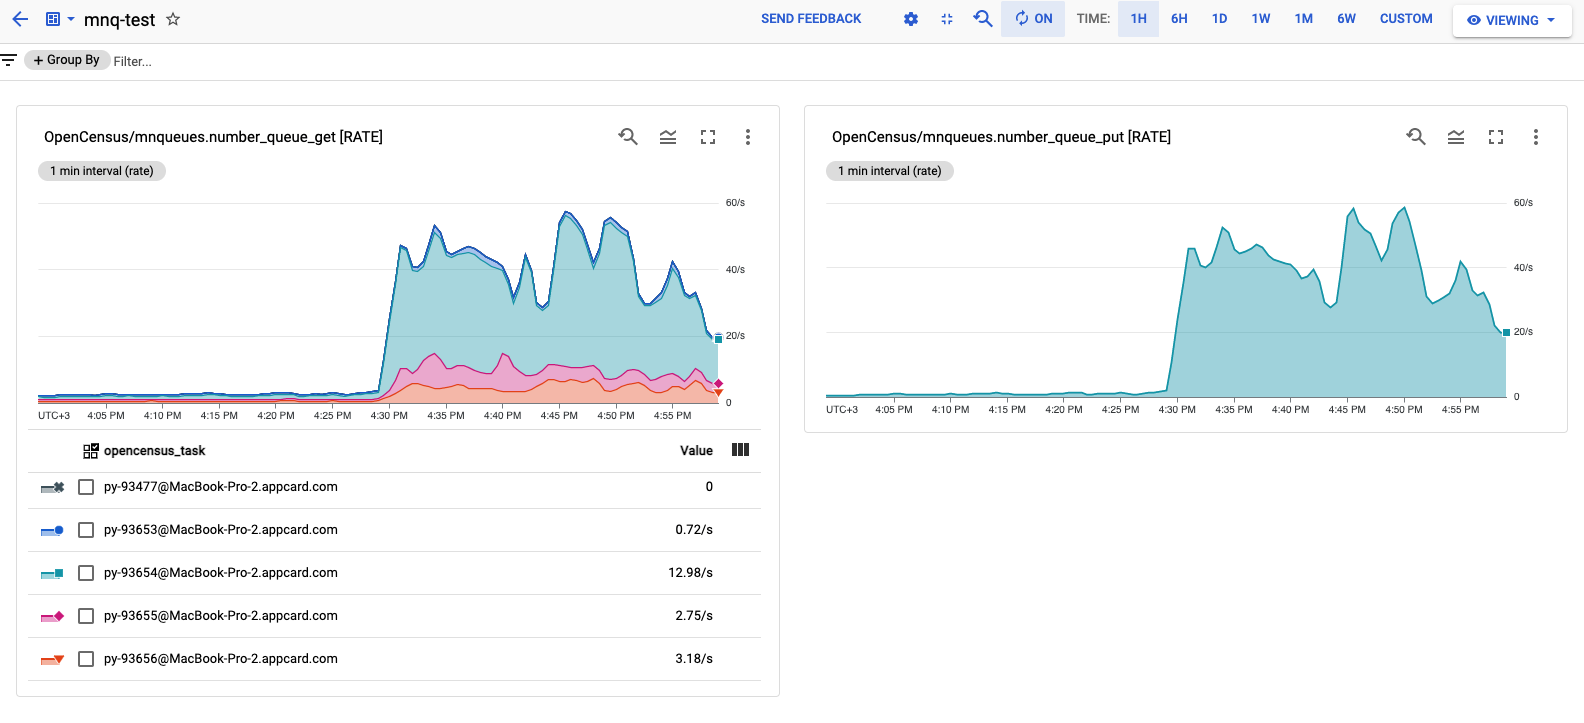
All calls to put() and get() are sent to Google Cloud Monitor. The Monitor class sends data to two custom measures:
OpenCensus/mnqueues.{name}.number_queue_get (line, no aggregation on GCP required)OpenCensus/mnqueues.{name}.number_queue_put (line, no aggregation on GCP required)OpenCensus/mnqueues.{name}.time_in_queue_distribution (heat-map with sum, shows latency distribution)Note that {name} is passed as a parameter when constructing the Monitor and it aims to assist in creating dash-boards for specific use-cases.
See for details.
pytest on the project tests folder.Can be found in the tests folder.
Contributions are highly appreciated. Please review our
Code of Conduct. Bug reports & feature requests can be left in the Issues section, or email me at amor71@sgeltd.com