Python 3 module for doing simultaneous linear regression
Least squares fitting is a underlying method for numerous applications, the most common one being linear regression. It consists in finding the parameters vector β° which minimizes ‖ε‖₂ in the equation y = Xβ + ε, where X is the design matrix, y the observation vector, and ε the error vector.
Since it is a fundamental algorithm, a number of Python 3 implementations exist, with different feature sets and performance, such as: numpy.linalg.lstsq, scipy.stats.linregress, sklearn.linear_model.LinearRegression and statsmodel.OLS.
However, the current available libraries are not designed to work on a large quantity of simultaneous problems, for example solving a least square problem for each pixel of an image. Iterating over a large number of small problems is inefficient. Moreover, when doing linear regression, it is often tedious to build the design matrix X.
The goal of multilstsq is to work on arrays of problems, with good performance, low memory requirements, reliability and flexibility. It also provides a way to automate the construction of the relevant structures (mostly the design matrix), using a model given as a string. It however does not strive to be a complete statistical library such as what would be provided by statsmodel or the language R.
To reach these goals, multilstsq uses the following techniques:
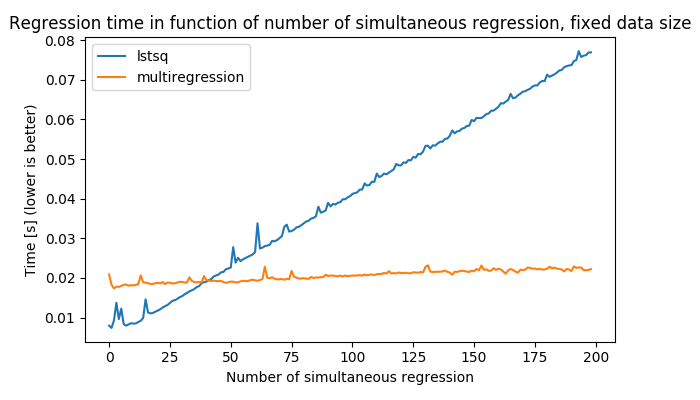
β°=(XᵀX)⁻¹Xᵀy incrementally, due to the linearity of XᵀX and Xᵀy, by providing data in chunks.XᵀX is done by explicit formulas when the dimension is small. This has the advantage of being vector operations which can be applied simultaneously on all problems.b0+b1*x0) into the complex expression needed to build the design matrix from the vector X provided by the user. In that example, it is: np.concatenate([np.ones(o_dim)[(..., np.newaxis)], ((X)[..., :, 0])[(..., np.newaxis)]]). This expression evaluator also may be useful for other purposes in other libraries.As shown in the following figure, this ensures the algorithm has good performance compared to a loop:
 .
.
import numpy as npfrom multilstsq import MultiRegressionx1 = np.array([1.47, 1.50, 1.52, 1.55, 1.57, 1.60, 1.63, 1.65, 1.68, 1.70, 1.73, 1.75, 1.78, 1.80, 1.83])y1 = np.array([52.21, 53.12, 54.48, 55.84, 57.20, 58.57, 59.93, 61.29, 63.11, 64.47, 66.28, 68.10, 69.92, 72.19, 74.46])x2 = np.arange(10)y2 = np.arange(10)X = np.ma.masked_all((2, max(len(x1), len(x2)), 1))y = np.ma.masked_all((2, max(len(x1), len(x2)), 1))X[0, :len(x1), 0] = x1X[1, :len(x2), 0] = x2y[0, :len(y1), 0] = y1y[1, :len(y2), 0] = y2mr = MultiRegression((2,), 'b0 + b1*x0 + b2*(x0**2)')mr.add_data(X,y)mr.switch_to_variance()mr.add_data(X,y)print(mr.beta)#Identify parameter names in the parameter vectorprint(mr.beta_names)#Get the covariance matrix for the first problemprint(mr.variance[0])#Get the expression to predict for the first problemexpr = mr.get_expr_for_idx((0,))#Evaluate at x=1.79print(expr(1.79))
The nice thing about this module is that it is possible to change the model by only changing the line instanciating the MultiRegression object. For example, for a quadratic regression:
mr = MultiRegression((2,), 'b0 + b1*x0 + b2*(x0**2)')
Documentation is available at http://multilstsq.readthedocs.io/
Please post issues and pull requests on github. Alternatively, you can also send your patches by email.
The following tools are used to ensure good code quality:
| Tool | Status |
|---|---|
| travis-ci |  |
| AppVeyor | |
| Coveralls |