Data Visualization and Classification of the three different Iris species (setosa, virginica and versicolor) using the Fisher's Iris data set.
![]()
![]()
![]()
An exploratory data analysis using statistics and data visualisation, and a very basic illustration of how this dataset can be used in machine learning.
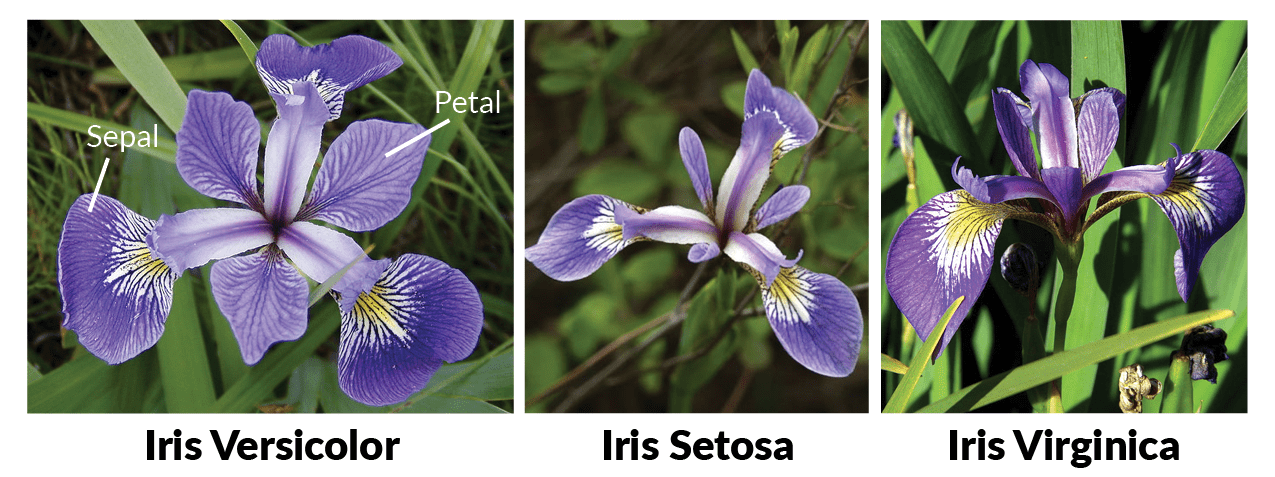
The dataset contains: 3 classes (3 different Iris species) with 50 samples each, with four numeric properties about those classes: Sepal Length, Sepal Width, Petal Length, and Petal Width.
One species, Iris Setosa, is “linearly separable” from the other two. This means that we can draw a line (or a hyperplane in higher-dimensional spaces) between Iris Setosa samples and samples corresponding to the other two species.
This is a supervised learning problem as the example provides both input (iris measurements) and output (iris species) pairs. The information from these pairings should ideally allow us to create a model that can accurately predict a species of iris when presented with new data inputs.
Classification is a type of supervised machine learning problem where the target (response) variable is categorical.
The steps in the construction of a supervised machine learning program are as stated individually below:
Make predictions.
Scikit-learn is a popular Python library used for creating machine learning models. There are several algorithms available in this library that can be used to build a machine learning model for the Iris Dataset. However, the ones I used this time around are:
Logistic Regression
Through the exploratory data analysis performed on this dataset, many intrigiung inferences could be drawn.
Takeaways
Which predictor(s) can effectively help with the predictions & conclusions? Which of the petal/sepal measurements are more useful to look at?
A) It is seen that Petal measurements have highly positive correlation, while the sepal one is uncorrelated.
It is also worth noting that the petal features have relatively high correlation with sepal_length, but not with sepal_width.
Therefore, petal measurements can separate species better than the sepal ones.
Furthermore, all the 3 models achieved a test accuracy of over 95% (~97%).