Regression Error Characteristic (REC) Curves in Python
![]()
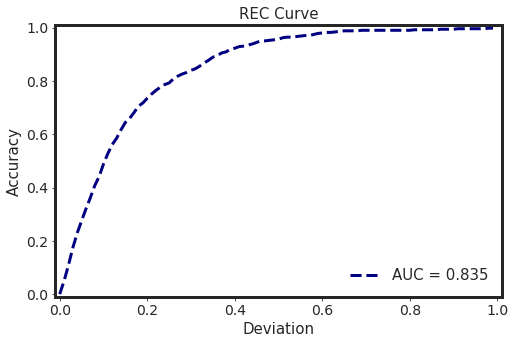
Regression Error Characteristic (REC) curves can be used to visualize
the performance of the regressor models. REC
illustrates the absolute deviation tolerance versus the fraction
of the exemplars predicted correctly within the tolerance interval.
The resulting curve estimates the cumulative distribution
function of the error. The area over the REC curve (AOC),
which can be calculated via the area under the REC curve
(AOC = 1 - AUC) is a biased estimate of the expected
error. Furthermore, the coefficient of determination (R^2) can also
be calculated with respect to the AOC Reference 1. Likewise the
ROC curve, the shape of the REC curve can also be used
as a guidance for the users to reveal additional information
about the data modeling. The REC curve was implemented
in Python and the details of the error metrics and scaling of
the residuals are also available Reference 2.
Here is an exmple of using REC. To learn more about the details, you can check Examples:
# plot REC curvefrom rec import RegressionErrorCharacteristicr = RegressionErrorCharacteristic(y_true, y_pred)r.plot()
This algorithm is also implemented in more details in SlickML library.
For more info, please check out SlickML GitHub and SlickML API Docs.
pip install slickml
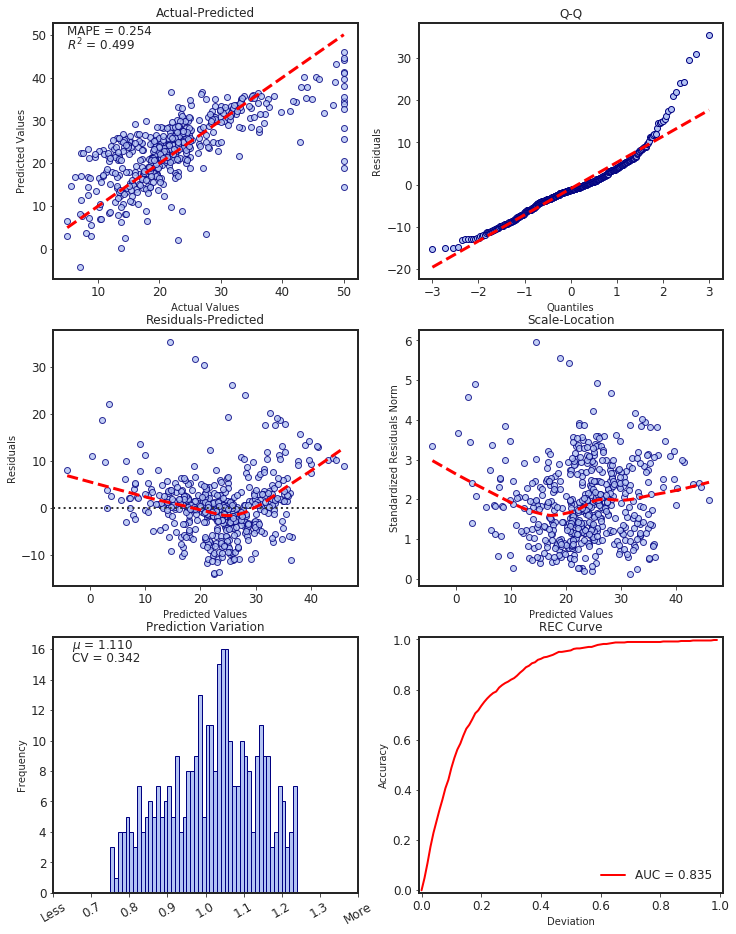
Here is an example using SlickML to quickly visualize the regression metrics:
# plot regression metricsfrom slickml.metrics import RegressionMetricsr = RegressionMetrics(y_true, y_pred)r.plot()
Pull requests are more than welcome!
If you use REC in academic work, please consider citing my SlickML library.
@software{slickml2020,title={SlickML: Slick Machine Learning in Python},author={Tahmassebi, Amirhessam and Smith, Trace},url={https://github.com/slickml/slick-ml},version={0.2.0},year={2021},}@article{tahmassebi2021slickml,title={Slickml: Slick machine learning in python},author={Tahmassebi, Amirhessam and Smith, Trace},journal={URL available at: https://github. com/slickml/slick-ml},year={2021}}


