Model Agnostics breakDown plots


The breakDown package is a model agnostic tool for decomposition of predictions from black boxes.
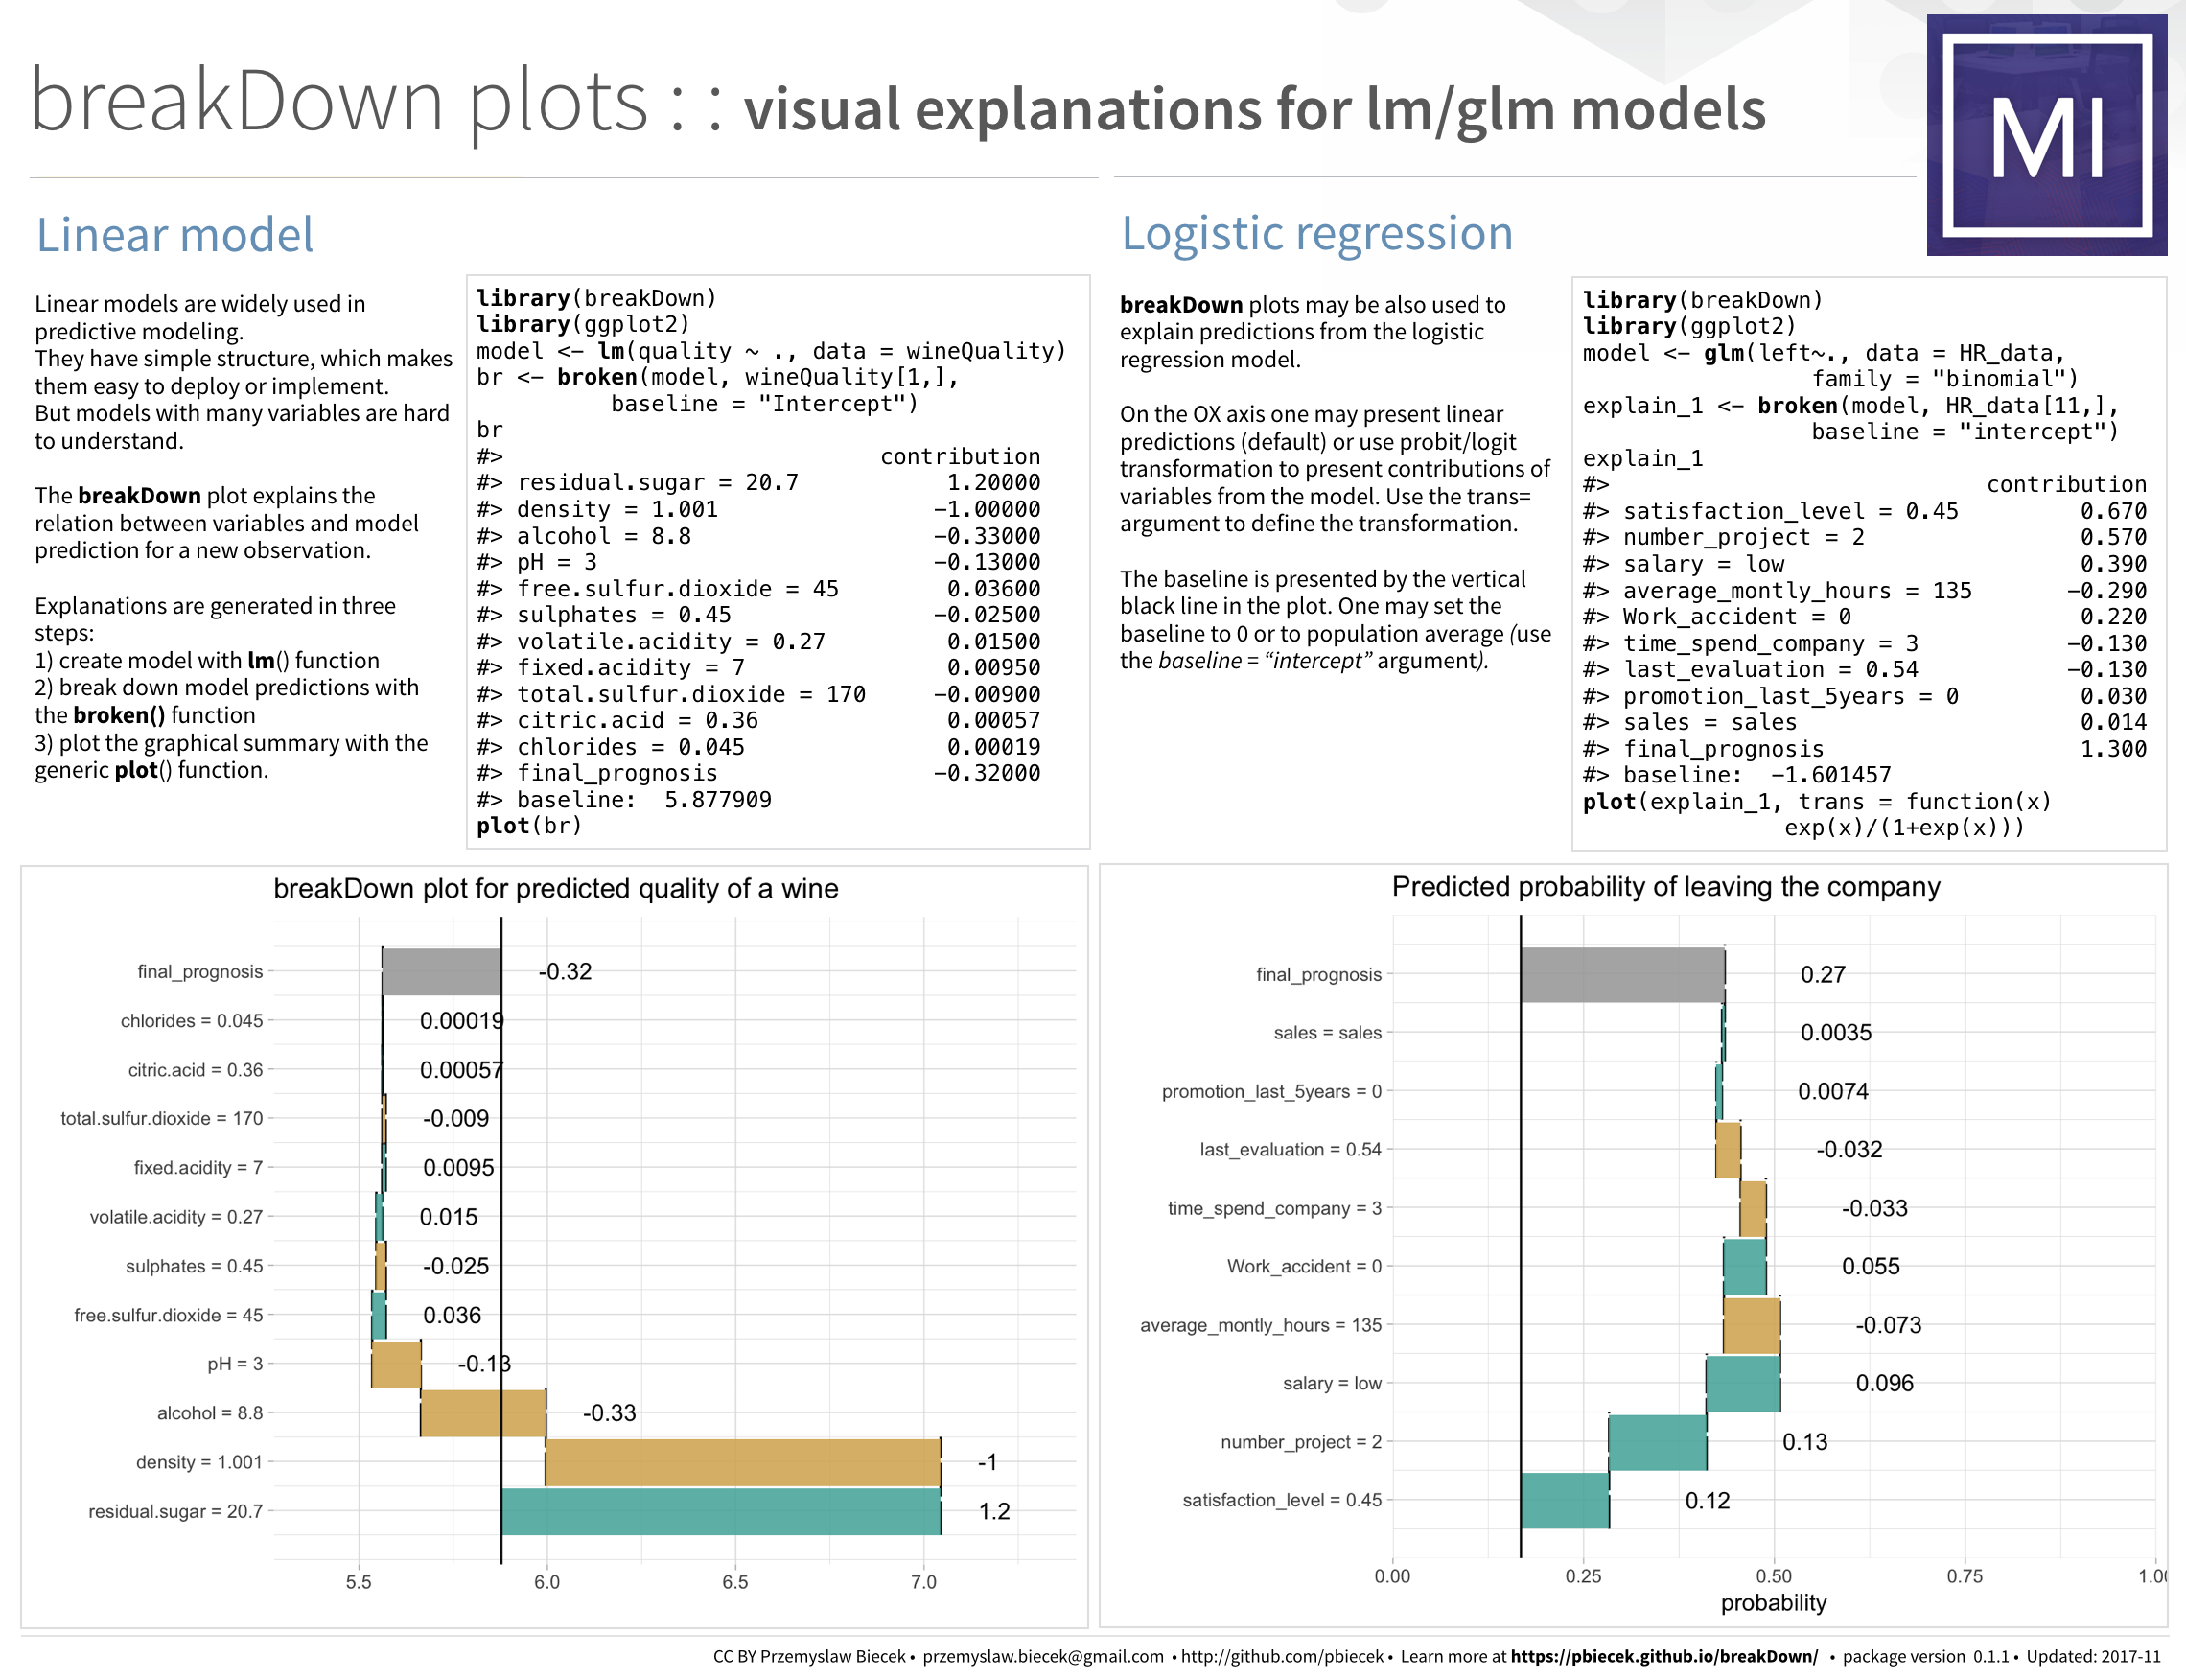
Break Down Table shows contributions of every variable to a final prediction.
Break Down Plot presents variable contributions in a concise graphical way.
This package works for binary classifiers and general regression models.
Find lots of R examples at breakDown website: https://pbiecek.github.io/breakDown/
Interested in the methodology? Find the math behind breakDown and live at: https://arxiv.org/abs/1804.01955
Looking for the python version of Break Down? Find it here: https://github.com/bondyra/pyBreakDown
New generation of the Break-Down algorithm is implemented in the iBreakDown package
https://github.com/ModelOriented/iBreakDown. All new features will be added to the iBreakDown.
Install from CRAN
install.packages("breakDown")
Install from GitHub
devtools::install_github("pbiecek/breakDown")
Get data with archivist
archivist::aread("pbiecek/breakDown/arepo/81c5be568d4db2ec795dedcb5d7d6599")archivist::aread("pbiecek/breakDown/arepo/7b40949a0fdf9c22780454581d4b556e")The R code
library(breakDown)url <- 'https://archive.ics.uci.edu/ml/machine-learning-databases/wine-quality/winequality-white.csv'wine <- read.table(url, header = T, sep=";")head(wine, 3)## fixed.acidity volatile.acidity citric.acid residual.sugar chlorides free.sulfur.dioxide total.sulfur.dioxide density pH## 1 7.0 0.27 0.36 20.7 0.045 45 170 1.0010 3.00## 2 6.3 0.30 0.34 1.6 0.049 14 132 0.9940 3.30## 3 8.1 0.28 0.40 6.9 0.050 30 97 0.9951 3.26## sulphates alcohol quality## 1 0.45 8.8 6## 2 0.49 9.5 6## 3 0.44 10.1 6model <- lm(quality ~ fixed.acidity + volatile.acidity + citric.acid + residual.sugar + chlorides + free.sulfur.dioxide + total.sulfur.dioxide + density + pH + sulphates + alcohol,data = wine)new_observation <- wine[1,]br <- broken(model, new_observation)br## contribution## (Intercept) 5.90000## residual.sugar = 20.7 1.20000## density = 1.001 -1.00000## alcohol = 8.8 -0.33000## pH = 3 -0.13000## free.sulfur.dioxide = 45 0.03600## sulphates = 0.45 -0.02500## volatile.acidity = 0.27 0.01500## fixed.acidity = 7 0.00950## total.sulfur.dioxide = 170 -0.00900## citric.acid = 0.36 0.00057## chlorides = 0.045 0.00019## final_prognosis 5.60000plot(br)
