Perception pipeline of 3D model to feed PR2 robot in ROS
This project main goal is performing a perception pipeline to identify objects using a RGB-D camera in a ROS as well to pick objects using PR2 robotic arms.
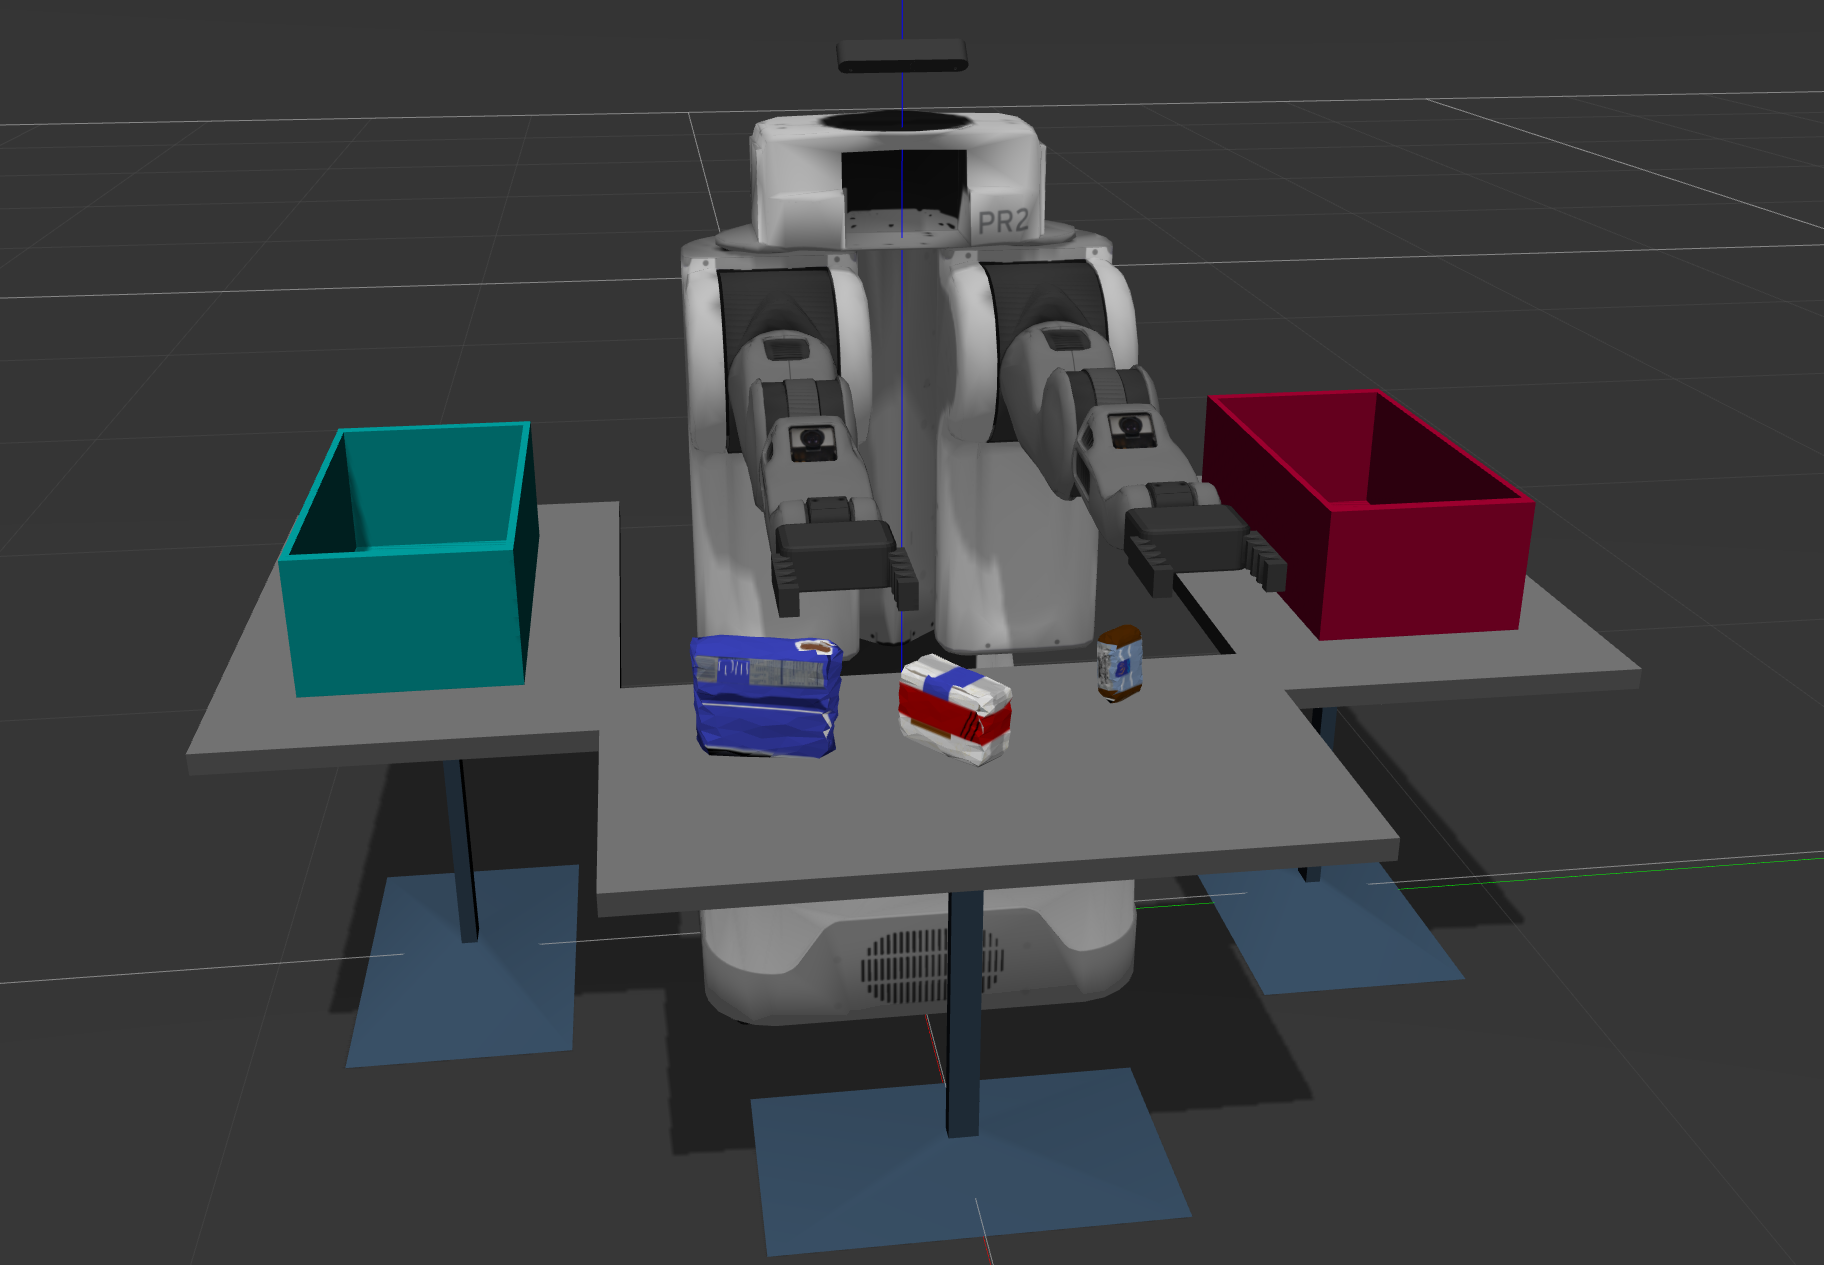
The ROS setup environment includes:
Robot
Table arrangement
Three target objects on the table
Dropboxes on either sides of the robot
For this setup, catkin_ws is the name of active ROS Workspace, if your workspace name is different, change the commands accordingly
If you do not have an active ROS workspace, you can create one by:
$ mkdir -p ~/catkin_ws/src$ cd ~/catkin_ws/$ catkin_make
Now install missing dependencies using rosdep install:
$ cd ~/catkin_ws$ rosdep install --from-paths src --ignore-src --rosdistro=kinetic -y
Build the project:
$ cd ~/catkin_ws$ catkin_make
Add following to your .bashrc file
export GAZEBO_MODEL_PATH=~/catkin_ws/src/RoboND-Perception-Project/pr2_robot/models:$GAZEBO_MODEL_PATH
If you haven’t already, following line can be added to your .bashrc to auto-source all new terminals
source ~/catkin_ws/devel/setup.bash
To run the the project, you should select first one of three scenarios in pick_place_project.launch file and launchg gazebo as follows:
$ roslaunch pr2_robot pick_place_project.launch
Once Gazebo is up and running, make sure you see following in the gazebo world:
Robot
Table arrangement
Three target objects on the table
Dropboxes on either sides of the robot
Afterwards, to run the pipeline and generate the labels for each object you run the 3dperception.py script:
$ rosrun pr2_robot 3dperception.py
Finally, to generate the data to traing SVM model you should also clone sensor_stick ROS package as follows:
$ cd ~/catkin_ws/src/$ git clone https://github.com/BrunoEduardoCSantos/3D-Perception/tree/master/sensor_stick$ cd ~/catkin/$ catkin_make$ source devel/setting.bash$roslaunch sensor_stick training.launch$rosrun sensor_stick capture_features.py
The contributions to this project were developed in the following files:
In the following sections will be addressed the approach taken to:
During this first stage of input data cloud pre-processing the following filtering processes were applied:
Outliers removal was applied to the cloud due to some points over the objects as we can tell from the initial point cloud.

In order to remove the outliers we Gaussian distribution, all points whose mean distances are outside of an interval defined by the global distances mean+standard deviation are considered to be outliers and removed from the point cloud. Since the density was not large, the following parameters were considered to define the statistical outlier removal:
After outlier removal we got point cloud after outliers removal.

The next step was applying a reduction of point cloud density to feed the train model later on . For this purpose, it was applied a voxel grid downsampling with the following parameter:
After applying this process we obtain voxel grid downsampling result

The principal to define the density was based on the minimal amout of points to have a object shape.
The next step was applying filtering on z-axis to remove table and on x-axis to remove dropboxes side bound.
For this purpose the following parameters were applied:
After applying pass through filtering we obtain pass through filter result.

The last step is fitting plane to extract objects from point cloud using RANSCAC, with a max_dist = 0.04. The small distance is due to density of objects point cloud.
After this final step we obtain RANSAC segmentation.

For the purpose of having segmenation of objects on the table it was used a spatial clustering algorithm called Euclidean clustering.
Euclidean clustering is based on a radius around a random point considering a minimum and maximum number of points to cluster a set of points.
Regarding this concept, it was applied Euclidean clustering with the following parameters values:
After segmentation process we obtain separate objects on the table.

In order to predict the labels of the point cloud objects we used as features the normals and colors of associated to each point of object point cloud. After having the dataset for each object we train a SVM model to predict the its label. For this purpose a linear kernel with a tradoff parameter C=0.55. Training on our test dataset we obtain the following confusion matrix.

After obtain our trained model , this one was applied on our pipeline applied to received images being streamed from camera node in ROS.
As a result, we label the objects for the provided test scenarios, i.e., for different objects on the table (test1.world, test2.world, test3.world).
For test1.world we obtained the following labeled objects:

For test2.world we obtained:

Finally, for test3.world we obtained:

Using the existing ros node that communicates with my perception pipeline to perform sequential object recognition, we obtain requests into output_1.yaml, output_2.yaml, and output_3.yaml for each scene respectively.
This project was cloned from Udacity perception project in the context of Robotics Software Engineer nanodegree.