GPU Logger for jupyter/ipython (memory usage, execution time)
Please see: https://github.com/stas00/ipyexperiments
GPU Logger for jupyter/ipython (currently logging memory and time).
This module is for those who need to track resource usage line by line in ipython or cell by cell in jupyter notebooks. You get the resource report automatically as soon as a command or a cell finished executing.
Currently this module logs GPU RAM, general RAM and execution time. But can be expanded to track other important thing. While there are various similar loggers out there, the main focus of this implementation is to help track GPU, whose main scarce resource is GPU RAM.
It’s trivial to use this module:
from ipygpulogger import IPyGPULoggerIPyGPULogger().start()
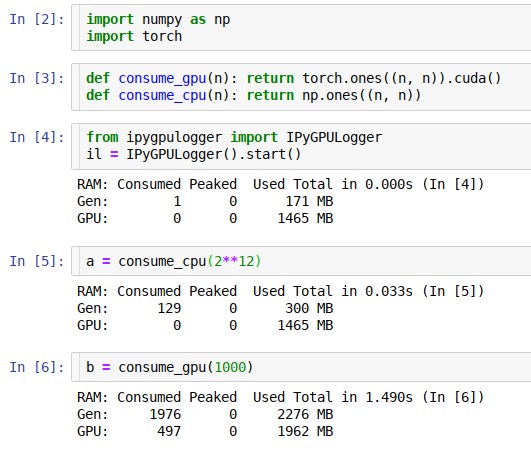
Then running a jupyter cell with some code, you get a report printed:
RAM: Consumed Peaked Used Total in 0.000s (In [4])CPU: 45 0 170 MBGPU: 2467 0 1465 MB
dev:
pip install git+https://github.com/stas00/ipygpulogger.git
Python 3.6+, and the rest of dependencies are automatically installed via pip (and soon conda).
The easiest way to see how this framework works is to read the demo notebook.
Currently supporting NVIDIA GPUs w/ pytorch, but it should be trivial to add support for other frameworks, like tensorflow, etc.
The only framework-specific code is framework preloading, device id access and cache clearing.
NVIDIA’s data is read directly via nvml nvidia-ml-py3.
Please, note, that this module doesn’t setup its pip/conda dependencies for the backend frameworks (e.g. pytorch), since you must have already installed those before attempting to use this module.
from ipygpulogger import IPyGPULogger
Create a logger object:
il = IPyGPULogger(compact=False, gc_collect=True)
Options:
compact - use compact one line printoutsgc_collect - correct memory usage reports. Don’t use when tracking memory leaks (objects with circular reference).Start logging if it wasn’t started in the constructor
il.start()
Stop logging
il.stop()
Access the measured data directly (in not rounded MBs)
cpu_mem, gpu_mem, time_data = il.dataprint(cpu_mem)print(gpu_mem)print(time_data)
gives:
IPyGPULoggerMemory(used_delta=128.0062427520752, peaked_delta=128.0133180618286, used_total=2282)IPyGPULoggerMemory(used_delta=1024, peaked_delta=1024, used_total=3184)IPyGPULoggerTime(time_delta=0.806537389755249)
This accessor returns 3 namedtuples, so that you can access the data fields by name. For example, continuing from above.
print(cpu_mem.used_delta)print(gpu_mem.used_total)print(time_data.time_delta)
or to unpack it:
cpu_mem_used_delta, cpu_mem_peaked_delta, cpu_mem_used_total = cpu_memgpu_mem_used_delta, gpu_mem_peaked_delta, gpu_mem_used_total = gpu_mem
Please refer to the demo notebook to see this API in action.
Often, a function may use more RAM than if we were just to measure the memory usage before and after its execution, therefore this module uses a thread to take snapshots of its actual memory usage during its run. So when the report is printed you get to see the maximum memory that was required to run this function.
For example if the report was:
RAM: Consumed Peaked Used Total in 0.000s (In [4])CPU: 0 0 170 MBGPU: 2567 1437 5465 MB
That means that when the function finished it consumed 2467 MB of GPU RAM, as compared to the memory usage before its run. However, it actually needed a total of 4000 MB of GPU RAM to be able to run (2467+1437). So if you didn’t have 4000 MB of free unfragmented RAM available it would have failed.
You do need to be aware that some frameworks consume a big chunk of general and GPU RAM when they are used for the first time. For example pytorch cuda eats up about 0.5GB of GPU RAM and 2GB of general RAM on load (not necessarily on import, but usually later when it’s used), so if your experiment started with doing a cuda action for the first time in a given process, expect to lose that much RAM - this one can’t be reclaimed.
But IPyGPULogger does all this for you, for example, preloading pytorch cuda if the pytorch backend (default) is used. During the preloading it internally does:
import pytorchtorch.ones((1, 1)).cuda() # preload pytorch with cuda libraries
Before a snapshot of used GPU RAM is made, its cache is cleared, since otherwise there is no way to get any real GPU RAM usage. So this module gives very reliable data on GPU RAM (but also see Temporary Memory Leaks.
For general RAM accounting, tracemalloc is used, which gives a correct report of how much RAM was allocated and peaked, which overcomes the interference of python internal caching. So if the code makes a large memory allocation, followed by its release and immediately a smaller allocation - the process’s total memory usage won’t change, yet it’ll report how much RAM a specific cell has allocated.
Modern (py-3.4+)gc.collect() handles circular references in objects, including those with custom __del__ methods. So pretty much eventually, when gc.collect() arrives, all deleted objects get reclaimed. The problem is that in the environments like machine learning training, eventually is not good enough. Some objects that are no longer needed could easily hold huge chunks of GPU RAM and waiting for gc.collect() to arrive is very unreliable bad method of handling that. Moreover, allocating more GPU RAM before freeing RAM that is already not serving you leads to memory fragmentation, which is a very bad scenario - as you may have a ton of free GPU RAM, but none can be used. And at least at the moment, NVIDIA’s CUDA doesn’t have a defrag method.
In order to give you correct memory usage numbers, this module by default runs gc.collect before clearing GPU cache and taking a measurement of its used memory. But this could mask problems in your code, and if you turn this module off, suddenly the same code can’t run on the same amount of GPU RAM.
So, make sure you compare your total GPU RAM consumption with and without gc_collect=True in the object IPyGPULogger constructor.
PRs with improvements and new features and Issues with suggestions are welcome.
pytest-ipynb (the original one is no longer being maintained)
pip install git+https://github.com/stas00/pytest-ipynb.git
make test
This module was modelled after:
A detailed history of changes can be found here.